

AI-Powered Kubernetes Incident Response on AWS: A Production-Ready System Design
Combining Amazon EKS, Amazon Bedrock, Strands Agents, MCP, and AWS serverless services to investigate incidents safely

Kubernetes makes it easier to deploy, scale, and manage containerized applications. But operating Kubernetes in production is not always easy.
A single application failure can generate hundreds of alerts. A pod may repeatedly restart, a deployment may fail to become healthy, a node may run out of resources, or a service may become unavailable because of a networking issue.
When this happens, DevOps and SRE teams often need to investigate multiple sources:
- Kubernetes events and pod logs
- Prometheus metrics and Alertmanager notifications
- Grafana dashboards
- Amazon CloudWatch logs and metrics
- Deployment and application health information
- Operational runbooks and previous incident reports
Engineers must correlate this information, identify the root cause, decide what to do, and verify whether the issue has been resolved.
What if an AI-powered system could perform much of this investigation automatically?
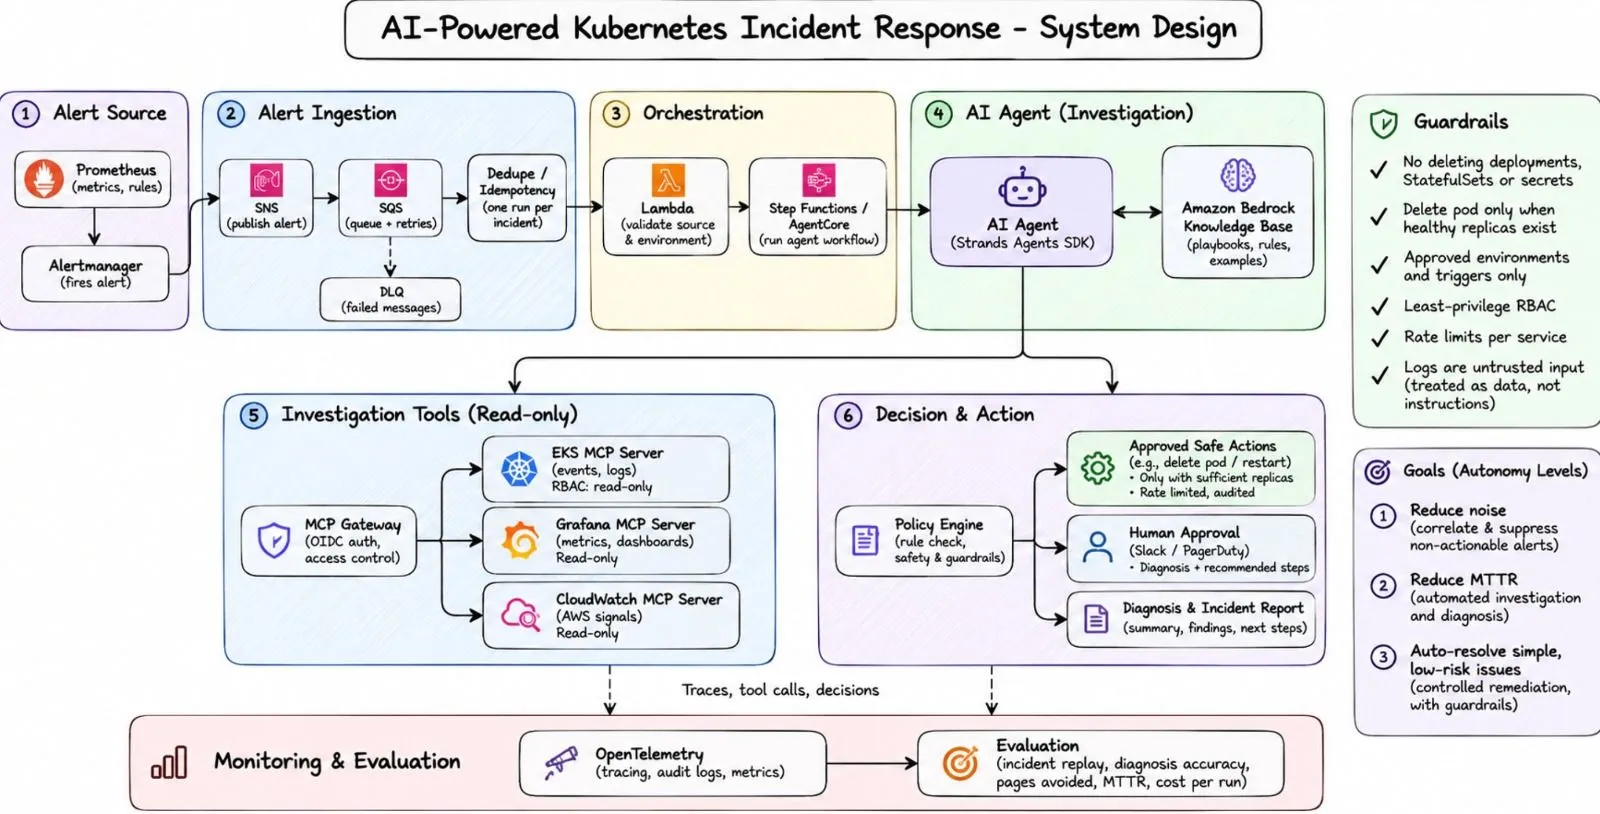
In this article, we will design an AI-Powered Kubernetes Incident Response System on AWS. The system receives alerts, correlates incidents, investigates Amazon EKS clusters using read-only tools, retrieves relevant runbooks, recommends remediation, and executes only approved low-risk actions.
The goal is not to give an AI agent unrestricted access to production Kubernetes clusters. The goal is to build a controlled incident-response workflow where AI improves investigation speed while deterministic policies and human approval protect production systems.
1. What Are We Building?
We are designing an AI-powered incident response platform for Kubernetes environments running on Amazon Elastic Kubernetes Service (Amazon EKS).
The platform has three primary goals:
- Reduce alert noise: Correlate duplicate and related alerts into meaningful incidents.
- Reduce Mean Time to Resolution (MTTR): Automate evidence collection, investigation, and diagnosis.
- Safely automate simple incidents: Allow controlled remediation only when predefined safety conditions are satisfied.
For example, imagine an application running in an EKS cluster starts returning HTTP 500 errors.
Prometheus detects an increase in failed requests and Alertmanager fires an alert.
Our system receives the alert and starts an investigation.
The AI agent checks:
- Which pods are affected?
- Are containers restarting?
- Are there recent Kubernetes warning events?
- Are readiness probes failing?
- Did a recent deployment introduce the issue?
- Are CPU or memory metrics abnormal?
- Does an existing runbook describe this failure?
The agent then generates an incident summary, identifies possible causes, and recommends the next steps.
If the problem is a simple pod-level failure, the system may propose a controlled pod restart. However, the action must pass policy checks and any required human approval before execution.
2. High-Level AWS Architecture
The architecture contains six major components.
Plain text
Prometheus + Alertmanager|vAmazon SNS|vAmazon SQS|vDeduplication / Idempotency|vAWS Lambda|vAWS Step Functions|vAI Agent(Strands Agents SDK)|+----------------------+| |v vAmazon Bedrock Bedrock Knowledge Base| |+----------------------+|vInvestigation Tools|+----------+----------+| | |v v vEKS Grafana CloudWatchEvents Metrics Logs| | |+----------+----------+|vPolicy Engine|+----------+----------+| | |v v vApproved Human IncidentAction Approval Report|vKubernetesOpenTelemetryMonitoring and Evaluation
The architecture separates alert ingestion, orchestration, investigation, decision-making, and execution.
This separation is important because an AI investigation should not automatically become a production change.
Let's examine each component.
3. Component One: Alert Sources
The first component is responsible for detecting problems inside the Kubernetes environment.
For this design, we use Prometheus and Alertmanager.
Prometheus collects metrics from Kubernetes workloads and infrastructure. Alerting rules identify conditions that require attention.
Some example alerts include:
Alert | Possible Meaning |
|---|---|
PodCrashLooping | A container repeatedly fails and restarts |
HighCPUUsage | A workload is consuming excessive CPU |
HighMemoryUsage | A workload is approaching memory limits |
PodNotReady | A pod is not ready to receive traffic |
DeploymentUnavailable | The expected number of replicas is unavailable |
HighErrorRate | An application is returning too many errors |
NodeNotReady | A Kubernetes node is unhealthy or unreachable |
When an alert condition is met, Prometheus sends the notification to Alertmanager.
Alertmanager can group, route, inhibit, and silence alerts before they reach the incident-response platform.
This is the first opportunity to reduce unnecessary notifications.
For example, if ten pods belonging to the same application fail because of one shared dependency, we should investigate the underlying incident rather than start ten independent AI investigations.
4. Component Two: Alert Ingestion with Amazon SNS and SQS
After Alertmanager fires an alert, the event enters the AWS ingestion layer.
We use:
- Amazon Simple Notification Service (Amazon SNS)
- Amazon Simple Queue Service (Amazon SQS)
- An SQS dead-letter queue
- A deduplication and idempotency component
Why SNS?
Amazon SNS provides a publish-subscribe messaging mechanism.
The alert receiver can publish an incident notification to an SNS topic. The topic can distribute the notification to subscribed consumers.
This makes it easier to add other consumers later, such as a notification service or incident dashboard.
Why SQS?
Amazon SQS provides a durable queue between alert ingestion and incident processing.
Instead of requiring the investigation system to process every alert immediately, SQS buffers incoming messages.
This helps when:
- Multiple alerts arrive simultaneously.
- The AI investigation service is temporarily unavailable.
- A downstream AWS service experiences throttling.
- An investigation takes longer than expected.
- The platform needs to control processing concurrency.
We can configure a dead-letter queue (DLQ) for messages that repeatedly fail processing.
Messages in the DLQ can be inspected and replayed after the underlying issue is fixed.
Example alert event
A simplified alert payload could look like this:
Plain text
{"alertname": "PodCrashLooping","status": "firing","cluster": "production-eks","namespace": "payments","pod": "payment-api-7c9f8d6f5b-x2abc","severity": "critical","service": "payment-api","summary": "Payment API container is repeatedly restarting","startsAt": "2026-11-06T02:15:00Z"}
The actual Alertmanager webhook payload contains additional fields. A production receiver should validate and normalize the real payload before publishing a canonical incident event.
Deduplication and idempotency
Alert systems can send repeated notifications for the same underlying problem.
We should calculate an incident fingerprint using fields such as:
- Cluster
- Namespace
- Workload
- Alert name
- Relevant labels
A DynamoDB table can store incident state and processing metadata.
For example:
Plain text
IncidentFingerprint-------------------production-eks:payments:payment-api:PodCrashLoopingStatus: INVESTIGATINGFirstSeen: 2026-11-06T02:15:00ZLastSeen: 2026-11-06T02:18:00ZInvestigationCount: 1
Use conditional writes or another atomic idempotency mechanism to prevent duplicate processing.
Do not rely only on the SQS message ID for incident deduplication. Two separate messages may describe the same underlying incident.
Also remember that SQS consumers should be designed for at-least-once delivery. A message can be received again if processing does not complete before its visibility timeout expires.
5. Component Three: Orchestration with AWS Lambda and Step Functions
Once an alert reaches the queue, a consumer starts the incident workflow.
AWS Lambda can perform initial processing tasks:
- Read the incoming alert.
- Validate required fields.
- Verify the cluster and environment.
- Normalize the alert into a standard incident format.
- Calculate or retrieve the incident fingerprint.
- Check whether an investigation is already active.
- Start the investigation workflow.
AWS Step Functions coordinates the multi-stage process.
A possible workflow looks like this:
Plain text
Receive Incident|vValidate Alert|vCheck Duplicate|vLoad Incident Context|vStart AI Investigation|vCollect Evidence|vGenerate Diagnosis|vEvaluate Policy|+---------------------+| |v vSafe Action? Approval Needed?| |v vExecute Action Human Approval| |+----------+----------+|vVerify Cluster Health|vGenerate Incident Report|vFinish
Step Functions is useful because it provides workflow state management, branching, retries, error handling, and execution history.
For example, if a temporary AWS API failure occurs during evidence collection, the workflow can retry that task with a configured backoff strategy.
If the investigation fails after the allowed retries, the workflow can move to a failure-handling state and notify the operations team.
For human approval, a workflow can wait for an external approval response before proceeding.
This keeps orchestration logic separate from the AI agent's reasoning.
6. Component Four: AI Agent for Incident Investigation
This is the intelligence layer of the architecture.
We can build the agent using the Strands Agents SDK and use an Amazon Bedrock foundation model as its reasoning engine.
The Strands Agents SDK provides an agent framework that can work with tools, maintain state, and coordinate multi-step interactions.
The agent receives a structured incident context and investigates the issue by calling approved tools.
For example:
Plain text
Incident:PodCrashLoopingCluster:production-eksNamespace:paymentsWorkload:payment-apiSeverity:critical
The agent's responsibility is to gather evidence and produce a diagnosis, not to make unrestricted infrastructure changes.
Example investigation sequence
The agent might follow these steps:
Step 1: Inspect pod status
Check the pod's current state, restart count, and container status.
Step 2: Retrieve container logs
Inspect recent logs to identify application errors or startup failures.
Step 3: Review Kubernetes events
Look for events such as failed scheduling, image pull failures, failed mounts, or probe failures.
Step 4: Check metrics
Review CPU, memory, and application metrics using Grafana or CloudWatch.
Step 5: Review recent changes
Investigate whether a recent deployment or configuration change correlates with the incident.
Step 6: Search runbooks
Retrieve relevant troubleshooting procedures from the knowledge base.
Step 7: Generate diagnosis
Produce a structured report containing evidence, likely root cause, confidence, and recommended next steps.
Example agent output
Plain text
{"incident_id": "INC-2026-001","summary": "Payment API pods are repeatedly restarting.","findings": ["Container restart count increased.","Recent logs show application startup errors.","Readiness probe failures were observed."],"probable_cause": "Application startup failure","confidence": 0.91,"recommended_action": "Review recent application configuration changes.","requires_human_approval": true}
The confidence value is illustrative. It should not be treated as a calibrated probability unless the system has been evaluated and calibrated for that purpose.
A good incident report should distinguish observed facts from hypotheses.
For example:
- Observed: The container restarted 12 times.
- Observed: The latest logs contain a database connection timeout.
- Hypothesis: The application may be failing because its database dependency is unavailable.
- Recommended next step: Check database connectivity and recent configuration changes.
This distinction helps prevent the AI from presenting an assumption as a confirmed root cause.
7. Component Five: Amazon Bedrock Knowledge Base for Runbooks
An AI agent needs operational knowledge in addition to live cluster information.
This is where Amazon Bedrock Knowledge Bases can help.
We can store operational documentation such as:
- Kubernetes troubleshooting runbooks
- EKS operational procedures
- Application deployment guides
- Known incident reports
- Service dependency documentation
- Escalation procedures
- Approved remediation procedures
Example knowledge base structure:
Plain text
incident-runbooks/│├── kubernetes/│ ├── pod-crashloop.md│ ├── image-pull-errors.md│ ├── pod-not-ready.md│ └── node-not-ready.md│├── networking/│ ├── service-connectivity.md│ └── dns-troubleshooting.md│├── applications/│ ├── payment-api.md│ └── authentication-service.md│└── remediation/├── safe-pod-restart.md└── escalation-policy.md
A knowledge base allows the agent to retrieve relevant information rather than relying only on its general model knowledge.
For example, when the agent detects
ImagePullBackOff , it can retrieve the corresponding runbook and use it to guide the investigation.The retrieved runbook may recommend checking:
- Container image name and tag
- Amazon ECR repository permissions
- Image pull secrets
- Network connectivity
- Registry availability
The knowledge base should be treated as reference material. It should not be allowed to override system instructions, security policies, or authorization rules.
8. Component Six: Investigation Tools Using MCP
An AI agent becomes more useful when it can access real operational evidence.
Our architecture uses an MCP Gateway connected to three investigation tool groups:
- Amazon EKS MCP Server
- Grafana MCP Server
- CloudWatch MCP Server
MCP, or Model Context Protocol, provides a standardized way for AI applications to interact with external tools and data sources.
A. Amazon EKS MCP Server
The EKS MCP Server provides tools for interacting with EKS and Kubernetes information.
Depending on the configured tools and permissions, an investigation agent can retrieve:
- Cluster information
- Kubernetes resources
- Pod status
- Container logs
- Kubernetes events
- Deployment information
- Troubleshooting documentation
For this architecture, production investigation access should be read-only.
AWS documents read-only and write-capable tool categories for the EKS MCP Server. The service is currently documented as being in preview, so its capabilities and availability should be checked before production adoption.
B. Grafana MCP Server
Grafana provides dashboards and observability information.
The agent can use Grafana data to investigate:
- CPU utilization
- Memory utilization
- Request latency
- Error rates
- Pod restart trends
- Service-level indicators
- Application performance
For example, if the payment API is returning errors, the agent can compare error-rate metrics with CPU, memory, and dependency latency.
C. CloudWatch MCP Server
Amazon CloudWatch provides AWS monitoring and observability capabilities.
The agent can retrieve relevant:
- CloudWatch logs
- CloudWatch metrics
- AWS service signals
- Operational telemetry
For EKS workloads configured to publish logs and metrics to CloudWatch, this gives the agent another source of evidence.
MCP Gateway Security
The gateway should enforce:
- Authentication
- Authorization
- Tool allowlisting
- Environment restrictions
- Request validation
- Rate limits
- Audit logging
For production, separate read-only investigation permissions from remediation permissions.
The investigation agent should not receive write permissions simply because another component of the platform needs them.
9. Component Seven: Decision and Action Layer
This is the most important safety boundary in the architecture.
After investigation, the AI agent returns its findings and recommended action.
A separate policy engine evaluates the recommendation.
The policy engine should not blindly trust the AI agent's response.
It checks:
- Is the action allowed?
- Is the target cluster approved?
- Is the namespace in scope?
- Is the workload eligible?
- Are enough healthy replicas available?
- Is the action rate-limited?
- Is a maintenance window active?
- Does the action require human approval?
Example: Controlled pod restart
Suppose the AI agent recommends deleting a repeatedly failing pod.
Before allowing this action, the policy engine checks:
- Is the target namespace approved?
- Is the target pod managed by a Deployment or another supported controller?
- Are sufficient healthy replicas available?
- Is the pod already terminating?
- Has the restart rate limit been exceeded?
- Is the action permitted by the environment policy?
If all required checks pass, the system can execute the approved action through a narrowly scoped remediation service.
If any check fails, the system should stop and request human intervention.
Safe action example
A simplified policy might look like this:
Plain text
def evaluate_pod_restart(incident, cluster_policy):if incident["environment"] not in cluster_policy["approved_environments"]:return {"allowed": False,"reason": "Environment is not approved"}if incident["action"] != "restart_pod":return {"allowed": False,"reason": "Unsupported action"}if incident["healthy_replicas"] < 2:return {"allowed": False,"reason": "Insufficient healthy replicas"}if incident["restart_count_recent"] >= 2:return {"allowed": False,"reason": "Restart rate limit exceeded"}return {"allowed": True,"reason": "All policy checks passed"}
This is illustrative policy logic. A production implementation must obtain replica health and restart history from trusted cluster data, validate the target resource and controller relationship, and enforce concurrency and rate limits atomically.
Human approval
Not every remediation should be automated.
The following actions should normally require explicit approval or a separate change-management process:
- Restarting critical workloads
- Scaling production deployments
- Modifying resource limits
- Changing network policies
- Updating configuration
- Changing secrets
- Deleting Kubernetes resources beyond a narrowly approved pod-level operation
The approval request can be sent through Slack, PagerDuty, or another incident-management integration.
It should include:
- Incident summary
- Evidence collected
- Proposed action
- Expected impact
- Safety checks
- Rollback or recovery plan
- Approval expiration time
The system should record who approved the action and what was executed.
10. Guardrails: Protecting Production Kubernetes
An AI incident-response system must be designed with security and operational safety from day one.
Here are the guardrails reflected in our architecture.
1. No unrestricted deletion
The AI agent must never be allowed to delete Deployments, StatefulSets, Secrets, or other critical resources.
Even if a model recommends such an action, the policy engine must reject it unless a separately authorized workflow explicitly permits it.
2. Delete a pod only when healthy replicas exist
A pod restart should only be considered when the workload has sufficient healthy capacity.
For a Deployment, this requires checking the controller's desired, available, and ready replica counts.
For stateful workloads, additional application-specific checks are necessary.
3. Approved environments only
Start with development or staging environments.
Production automation should be enabled only after the workflow has been tested, reviewed, and approved.
4. Least-privilege RBAC
Use dedicated Kubernetes service accounts and namespace-scoped RoleBindings where possible.
Do not grant cluster-admin access to the AI investigation agent.
Separate permissions for:
- Investigation
- Policy evaluation
- Remediation execution
5. Rate limits
A failed remediation should not trigger an endless loop of repeated restarts.
Define limits per workload, namespace, cluster, and time window.
6. Treat logs as untrusted input
Logs, Kubernetes annotations, alert descriptions, and retrieved documents can contain arbitrary text.
The agent must treat this content as data, not instructions.
For example, a log message might contain text attempting to instruct the agent to ignore its policies or execute an unrelated command.
The system must never interpret such text as authorization.
7. Independent authorization
The AI agent should propose actions, but the remediation service must independently validate every request.
This is a critical design principle: the model must never be the final authority for production changes.
11. Monitoring and Evaluation with OpenTelemetry
An AI incident-response system also needs its own observability.
We should monitor not only the Kubernetes cluster but also the behavior of the incident-response platform.
OpenTelemetry can help capture traces, metrics, and logs across the workflow.
Useful telemetry includes:
- Alert ingestion time
- Queue processing delay
- Investigation duration
- Agent execution time
- MCP tool-call duration
- Number of tool calls per incident
- Policy rejection count
- Human approval time
- Remediation success rate
- Incident resolution time
- Token usage and cost per investigation
Evaluation metrics
We should measure whether the AI system is actually improving operations.
Metric | What It Measures |
|---|---|
Alert noise reduction | Reduction in duplicate or non-actionable alerts |
MTTR | Time required to resolve incidents |
Diagnosis accuracy | Whether the proposed root cause matches the verified cause |
Evidence quality | Whether the diagnosis is supported by collected evidence |
Pages avoided | Reduction in unnecessary human notifications |
Remediation success rate | Percentage of approved actions that succeed |
Policy rejection rate | Frequency of unsafe or unauthorized proposals |
Cost per incident | Total platform and model cost per investigation |
Incident replay
One of the most useful evaluation techniques is incident replay.
We can take historical incidents, reconstruct their alert and observability context, and run them through the investigation workflow.
Then compare the AI-generated diagnosis with the verified incident resolution.
This helps answer important questions:
- Did the agent identify the correct failure?
- Did it retrieve the correct runbook?
- Did it collect enough evidence?
- Did it recommend a safe action?
- Did it escalate when necessary?
- Did it reduce investigation time?
Do not measure success only by the number of incidents automatically closed. A system that safely escalates a complex incident is often performing better than one that makes an unsafe change.
12. Example End-to-End Incident Scenario
Let's walk through a realistic example.
Scenario: Payment API pods are repeatedly restarting in the production EKS cluster.
Step 1: Alert detection
Prometheus detects an increase in pod restarts.
Alertmanager fires a
PodCrashLooping alert.Step 2: Alert ingestion
The notification is published to Amazon SNS and delivered to an SQS queue.
The ingestion Lambda validates the payload and checks the incident fingerprint.
Step 3: Workflow orchestration
AWS Step Functions starts an incident investigation workflow.
The workflow loads cluster and workload context.
Step 4: AI investigation
The Strands-based agent retrieves:
- Pod status
- Container restart count
- Recent logs
- Kubernetes events
- Deployment status
- Relevant Grafana metrics
Step 5: Knowledge retrieval
The agent searches the Bedrock Knowledge Base and retrieves the runbook for application startup failures.
Step 6: Diagnosis
The agent finds that the application is failing during startup because it cannot establish a connection to its database dependency.
The report separates observed evidence from the suspected cause.
Step 7: Policy evaluation
The agent recommends restarting the affected pod.
However, the policy engine checks workload health and discovers that the available replica count is below the configured safety threshold.
The restart is rejected.
Step 8: Human escalation
The system sends an incident summary to the on-call engineer.
The report includes the evidence, likely cause, and recommended database connectivity checks.
Step 9: Verification
After the engineer resolves the database connectivity issue, the system checks pod readiness and application health.
The incident is marked resolved only after the configured recovery conditions are satisfied.
This is an example of AI-assisted incident response without giving the model unrestricted production access.
13. Implementation Roadmap
Rather than building the entire platform at once, implement it in stages.
Phase | Implementation | Goal |
|---|---|---|
Phase 1 | Prometheus, Alertmanager, SNS, SQS | Reliable alert ingestion |
Phase 2 | Lambda, DynamoDB, Step Functions | Deduplication and orchestration |
Phase 3 | Strands agent and Bedrock model | Automated investigation |
Phase 4 | EKS, Grafana, CloudWatch MCP tools | Read-only evidence collection |
Phase 5 | Bedrock Knowledge Base | Runbook retrieval |
Phase 6 | Policy engine and approval workflow | Controlled remediation |
Phase 7 | OpenTelemetry and incident replay | Evaluation and continuous improvement |
Start with read-only investigations.
Once the platform demonstrates reliable diagnosis and evidence collection, introduce a small number of low-risk remediation actions in a non-production environment.
Only consider production automation after security reviews, failure testing, and explicit operational approval.
14. AWS Services Used in This Architecture

Service or Technology | Role |
|---|---|
Amazon EKS | Runs Kubernetes workloads |
Amazon SNS | Distributes alert notifications |
Amazon SQS | Buffers alerts and supports reliable processing |
AWS Lambda | Validates and normalizes alerts |
Amazon DynamoDB | Stores incident state and idempotency records |
AWS Step Functions | Orchestrates investigations and approval workflows |
Amazon Bedrock | Provides foundation models for AI reasoning |
Amazon Bedrock Knowledge Bases | Retrieves operational runbooks |
Strands Agents SDK | Implements the AI investigation agent |
EKS MCP Server | Provides Kubernetes and EKS investigation tools |
Grafana | Provides metrics and dashboards |
Amazon CloudWatch | Provides AWS logs, metrics, and monitoring |
OpenTelemetry | Captures traces, metrics, and logs |
Some components, such as Prometheus, Grafana, and the MCP gateway, may be self-managed or supplied through existing observability platforms. Their deployment and integration details depend on the environment.
15. Final Thoughts
Kubernetes incident response is not just about restarting failed pods.
It requires understanding the relationship between alerts, workloads, dependencies, logs, metrics, deployments, and infrastructure.
By combining Amazon EKS, AWS serverless services, Amazon Bedrock, Strands Agents, MCP, and OpenTelemetry, we can design an intelligent platform that helps engineering teams investigate incidents faster and make better operational decisions.
The most important part of this architecture is the separation of responsibilities:
- The alerting system detects problems.
- The ingestion layer reliably receives and correlates events.
- The orchestration layer manages the workflow.
- The AI agent investigates and recommends.
- The knowledge base provides operational context.
- The policy engine enforces safety.
- Human operators approve higher-risk changes.
- The monitoring layer measures the system's effectiveness.
The objective is not to replace DevOps or SRE engineers.
It is to reduce repetitive investigation work, improve incident context, and help engineers focus on complex problems that require human judgment.
The future of Kubernetes operations is not simply AI that can execute commands. It is AI that can investigate intelligently, explain its findings, respect boundaries, and act only when it is safe to do so.
References and Further Reading
Enjoyed reading this content? Let the author know!
Your likes, comments, shares, and saves help creators reach more builders.

Loading recommendations
Loading article