
Our Synthetic Monitors Were Timing Out. The Scripts Were Fine.
How two compounding infrastructure problems masked a test-quality problem, and the dashboard we built so we'd never debug it blind again.

The complaint
"Most of our synthetic monitors are timing out. It's not the scripts" That's how it started. Around 140 scripted-browser monitors, a smoke test suite covering two environments running against a New Relic Synthetics private location backed by t2.large 8 EC2s.
Monitors were failing in bulk with
JobTimeoutError, Element never became visible, Timed-out waiting for element .
The QA team said scripts worked when run by hand. When SRE team looked at the servers and they seems fine, CPU wasn't pinned, memory was fine, nothing was crash-looping.
Both were right, which is why it took a while.
Background: How a private location actually works

Three properties matter:
- A 'lane' is one concurrent heavyweight check. The job manager reserves one CPU for it self, so a 4-vCPU host gets 3 lanes. A browser check needs a full core, Chrome is no a background task.
- Job managers pull. You cannot predict or control which host runs which check.
- Telemetry arrives on completion. While a check is queued or running, nothing is reported. This is why "it looks fine" and "it's broken" can be both true.
The measurement that settled the argument
Everyone was staring at CPU graphs. The decisive query took thirty seconds and nobody had run it:
SELECT average(executionDuration),
       average(`nr.internalQueueDuration`),
       average(`nr.externalQueueDuration`)
FROM SyntheticCheck WHERE locationLabel = '<our-location>'
SINCE 1 day ago
average execution time 77 s
average internal queue wait 2.5 s
average EXTERNAL queue wait 553 s ← 9.2 MINUTES
Queue wait was 7x the execution time. Worst observed 1,733 seconds, a check that sat for 29 minutes before it started.
That single ratio ends the "is the scripts or the servers?" argument permanently. The scripts weren't slow. The checks weren't running.
Lesson 1: measure queue wait separately from execution time. It is the one diagnostic that distinguishes a capacity problem from a code problem, and most dashboards don't show it.
Root cause #1: Burstable instances and CPU-bound work
The fleet was 8
t2.large . From AWS.
t2.large property : valuevCPUs: 2 → lanes = 2 − 1 = 1 per host
CPU credits earned/hour: 36
Baseline utilization: 30% per vCPU → 0.6 vCPU sustained, total
Credit accrual cap: 864 (≈24 hours' worth)
Default credit mode: **Standard **(T2 — not Unlimited)
Credits on stop/start: Lost
two separate problems in one line of that table:
Only 8 lanes across the whole fleet. 8 hosts x 1 lane. For 140 monitors.
Lesson 2: never put CPU-bond sustained work on burstable instances. And check
CPUCreditBalance in CloudWatch before believing a CPU graph.
Root cause #2: queuing in non-linear
Demand was measurable:
demand                      = 6.35 jobs/min
load-weighted avg runtime   = 77.3 s
lanes needed at 100% busy   = 6.35 × (77.3 / 60) = 8.18
lanes available             = 8
                            ────────────────────
utilization                 = 102%
Not 300% over. Not catastrophically mis-sized. 2% over.
And that's the trap. Queue wait doesn't rise linearly with utilization, it rises asymptotically:

Utilisation 20% 40% 50% 60% 70% 80% 85% 90% 95% 100%
Queue wait ~0 s 1 s 2 s 5 s 14 s 38 s 80 s 170 s 330 s 470 s
Our two measured points sit at either end of that curve: 48% utilization -> 0.4 s, and 102% -> 438 s.
Lesson 3: size for 40-55% average utilization, not 90%. The spare capacity isn't waste; It's what keeps latency bounded under random arrivals.
The counter-intuitive fix: Fever servers
We replaced 8 × t2.large with 4 × m6i.xlarge.
Half the instance count. Here's why that's more capacity, not less:
| 8 × t2.large | 4 × m6i.xlarge |
|---|---|---|
vCPU per host | 2 | 4 |
Lanes per host | 1 | 3 |
Total lanes | 8 | 12 |
Sustained vCPU per host | 0.6 (throttled) | 4.0 (full) |
Fleet sustained vCPU | 4.8 | 16.0 |
Monthly cost | ~$574 | ~$577 |
Same spend. 2.5× the lanes. 3.3× the sustained CPU. The old fleet was paying a premium for capacity it was never allowed to use.
The result
Metric | Before | After |
|---|---|---|
Average queue wait | 438 s | 0.4 s |
Average execution time | 78.8 s | 54.2 s |
Job timeouts | 4.7% of checks | 3.1% |
Lane utilisation | ~102% | ~48% |
Monthly cost | ~$574 | ~$577 |
A 99.9% reduction in queue wait at flat cost.
The surprise that changed the sizing
Execution time dropped 31% from 78.8 s to 54.2 s for the same scripts. That was the CPU throttling leaving. And it created a feedback loop in the arithmetic:
lanes needed = demand × avg_runtime

Sized with THROTTLED runtime (77 s):  6.35 × 1.29 = 8.2 lanes → ~18 lanes for headroom → 6 hosts
Sized with REAL runtime     (54 s):  6.35 × 0.90 = 5.7 lanes → ~12 lanes for headroom → 4 hosts
The strategy question: add capacity, or fix the schedule?
Monitors on harmonic periods (10/15/30 min) can collide. If all phases align, every monitor is due at the top of the hour at once:

Average demand 5.8/min. Peak demand 116/min. A 20x ratio, and no amount of average capacity fixes a peak like that.
So which problem did we have?

The Dashboard
The diagnosis above took days of ad-hoc NRQL. None of it was hard; all of it was findable only if you knew which five queries to run. We didn't want to rediscover that next quarter, so we built a dashboard.
The key architectural decision: don't build a database
The obvious design is a collector writing to Postgres, an API over it, and a UI. We nearly built that. Then:
New Relic is already the database. NRDB stores all the history and NRQL queries it well. Duplicating it into RDS buys an invoice and a sync bug.
The only reason a backend exists at all is that a browser cannot hold a New Relic User key, that key can read and modify the entire account. So the backends' entire job is to hold one credential and expose a narrow, read-only surface.
That reduced v1 to: static files, one Lambda, no database.
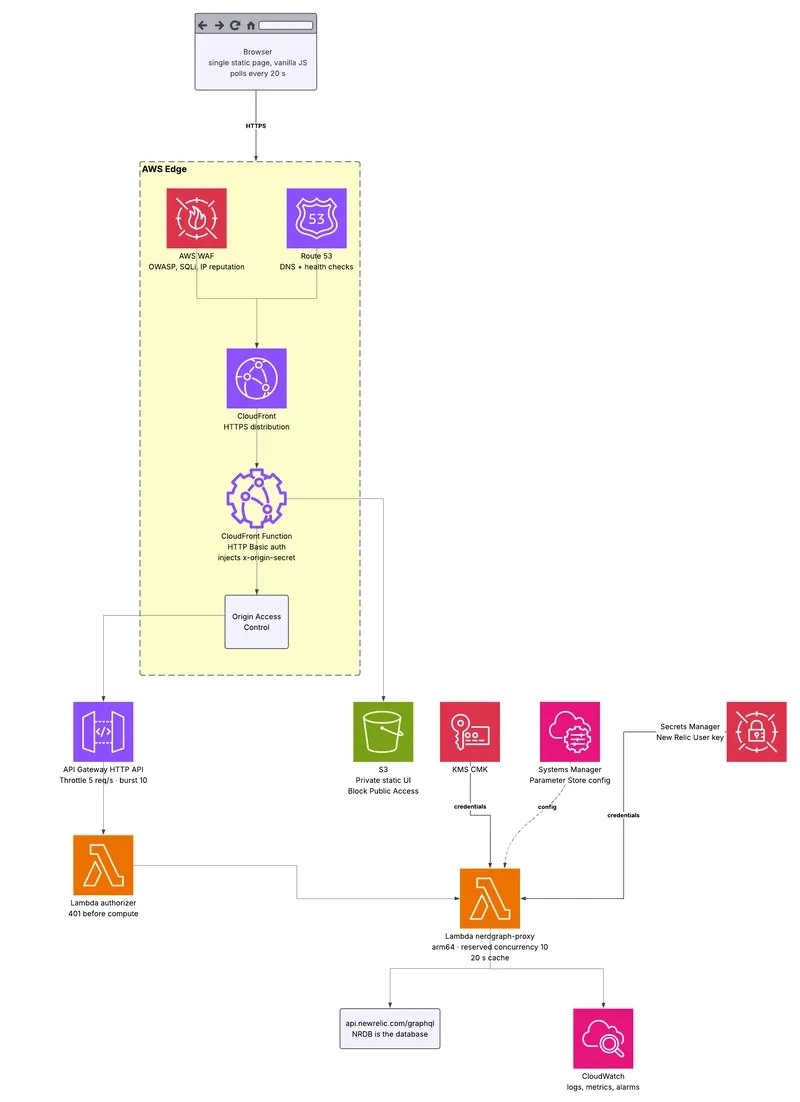
AWS services, and why each one
Service | Role | Why this one |
|---|---|---|
S3 | static UI | Account-level Block Public Access made website hosting impossible, which forced OAC, the better pattern anyway |
CloudFront | HTTPS, auth, single origin | Serving the API as a second origin on the same distribution means no CORS, and the auth function covers the API too |
CloudFront Functions | HTTP Basic at the edge | Cheaper and faster than Lambda@Edge for a header check |
API Gateway HTTP API | routing, throttling, authorizer | ~70% cheaper than REST API; everything here is a simple proxy |
Lambda (arm64) | NerdGraph proxy | Holds the credential. arm64 is ~20% cheaper per ms |
Secrets Manager + KMS | the New Relic key | Customer-managed key so usage is auditable and revocable |
SSM Parameter Store | non-secret config + generated origin secret | Changeable without a redeploy; SecureString for the machine-only secret |
CloudWatch | alarms + ops dashboard | Alarms watch the plumbing; the fleet's own alarms belong in New Relic |
CloudFormation | five separate stacks | Separate, not nested, they change at very different rates |
Strategies that mattered
- Allow-listed panels, never raw NRQL. The browser sends
?panel=fleet,queue. If it could send NRQL, the dashboard would be an open NRDB query endpoint for anyone who got past the password. Adding a panel is a code change and a code review, deliberately.
- One batched NerdGraph document per refresh. All panels in a single request using GraphQL aliases, cached 20 s server-side. Ten viewers cost the same New Relic quota as one.
- Alias every NRQL aggregate. This one bit us hard enough to earn its own section below.
- Defence in depth on the API. CloudFront injects a shared secret header; an API Gateway authorizer validates it; the proxy Lambda validates it again. If the authorizer is ever accidentally detached, the API doesn't silently open.
- Reject before compute. Because the authorizer declares
IdentitySource: $request.header.x-origin-secret, API Gateway returns 401 itself when the header is absent — no Lambda invocation at all. We proved it: 15 unauthenticated requests produced zero invocations on either function. Combined with a 5 req/s throttle, worst-case abuse cost fell from ~$97/month to ~$13/month.
- Keep the Lambda out of the VPC. It only calls public endpoints. In-VPC would add ENI cold starts and NAT data charges for nothing.
- Poll; don't build SSE. Underlying data only changes once a minute. The UI polls every 20 s and animates between snapshots client-side, visually live, with no WebSocket machinery.

What the dashboard shows that New Relic doesn't
New Relic ships a perfectly good private-location dashboard. We import it. The custom app exists only for what doesn't exist elsewhere:
- Queue wait as a first-class column next to execution time — the ratio that ends the capacity-versus-code argument
- A live flow view: queue → lanes → results, one dot per real check, coloured by outcome
- Per-monitor capacity consumption — which monitors eat your lanes, ranked
- Missing-check detection — expected (from configured period) versus observed
- A what-if simulator — change lane count and period, see predicted queue before buying anything
One honest limitation:
SyntheticCheck.minion returns "unknown" in our account, so per-check host attribution isn't available from telemetry. The flow view shows lane occupancy accurately but fills slots left-to-right by count, not identity. True per-lane attribution needs an agent on the hosts, which we deliberately deferred, because reading the Docker socket is root-equivalent and that's a conversation with the security team, not a code change.The Dashboard UI

Enjoyed reading this content? Let the author know!
Your likes, comments, shares, and saves help creators reach more builders.

Loading recommendations
Loading article