
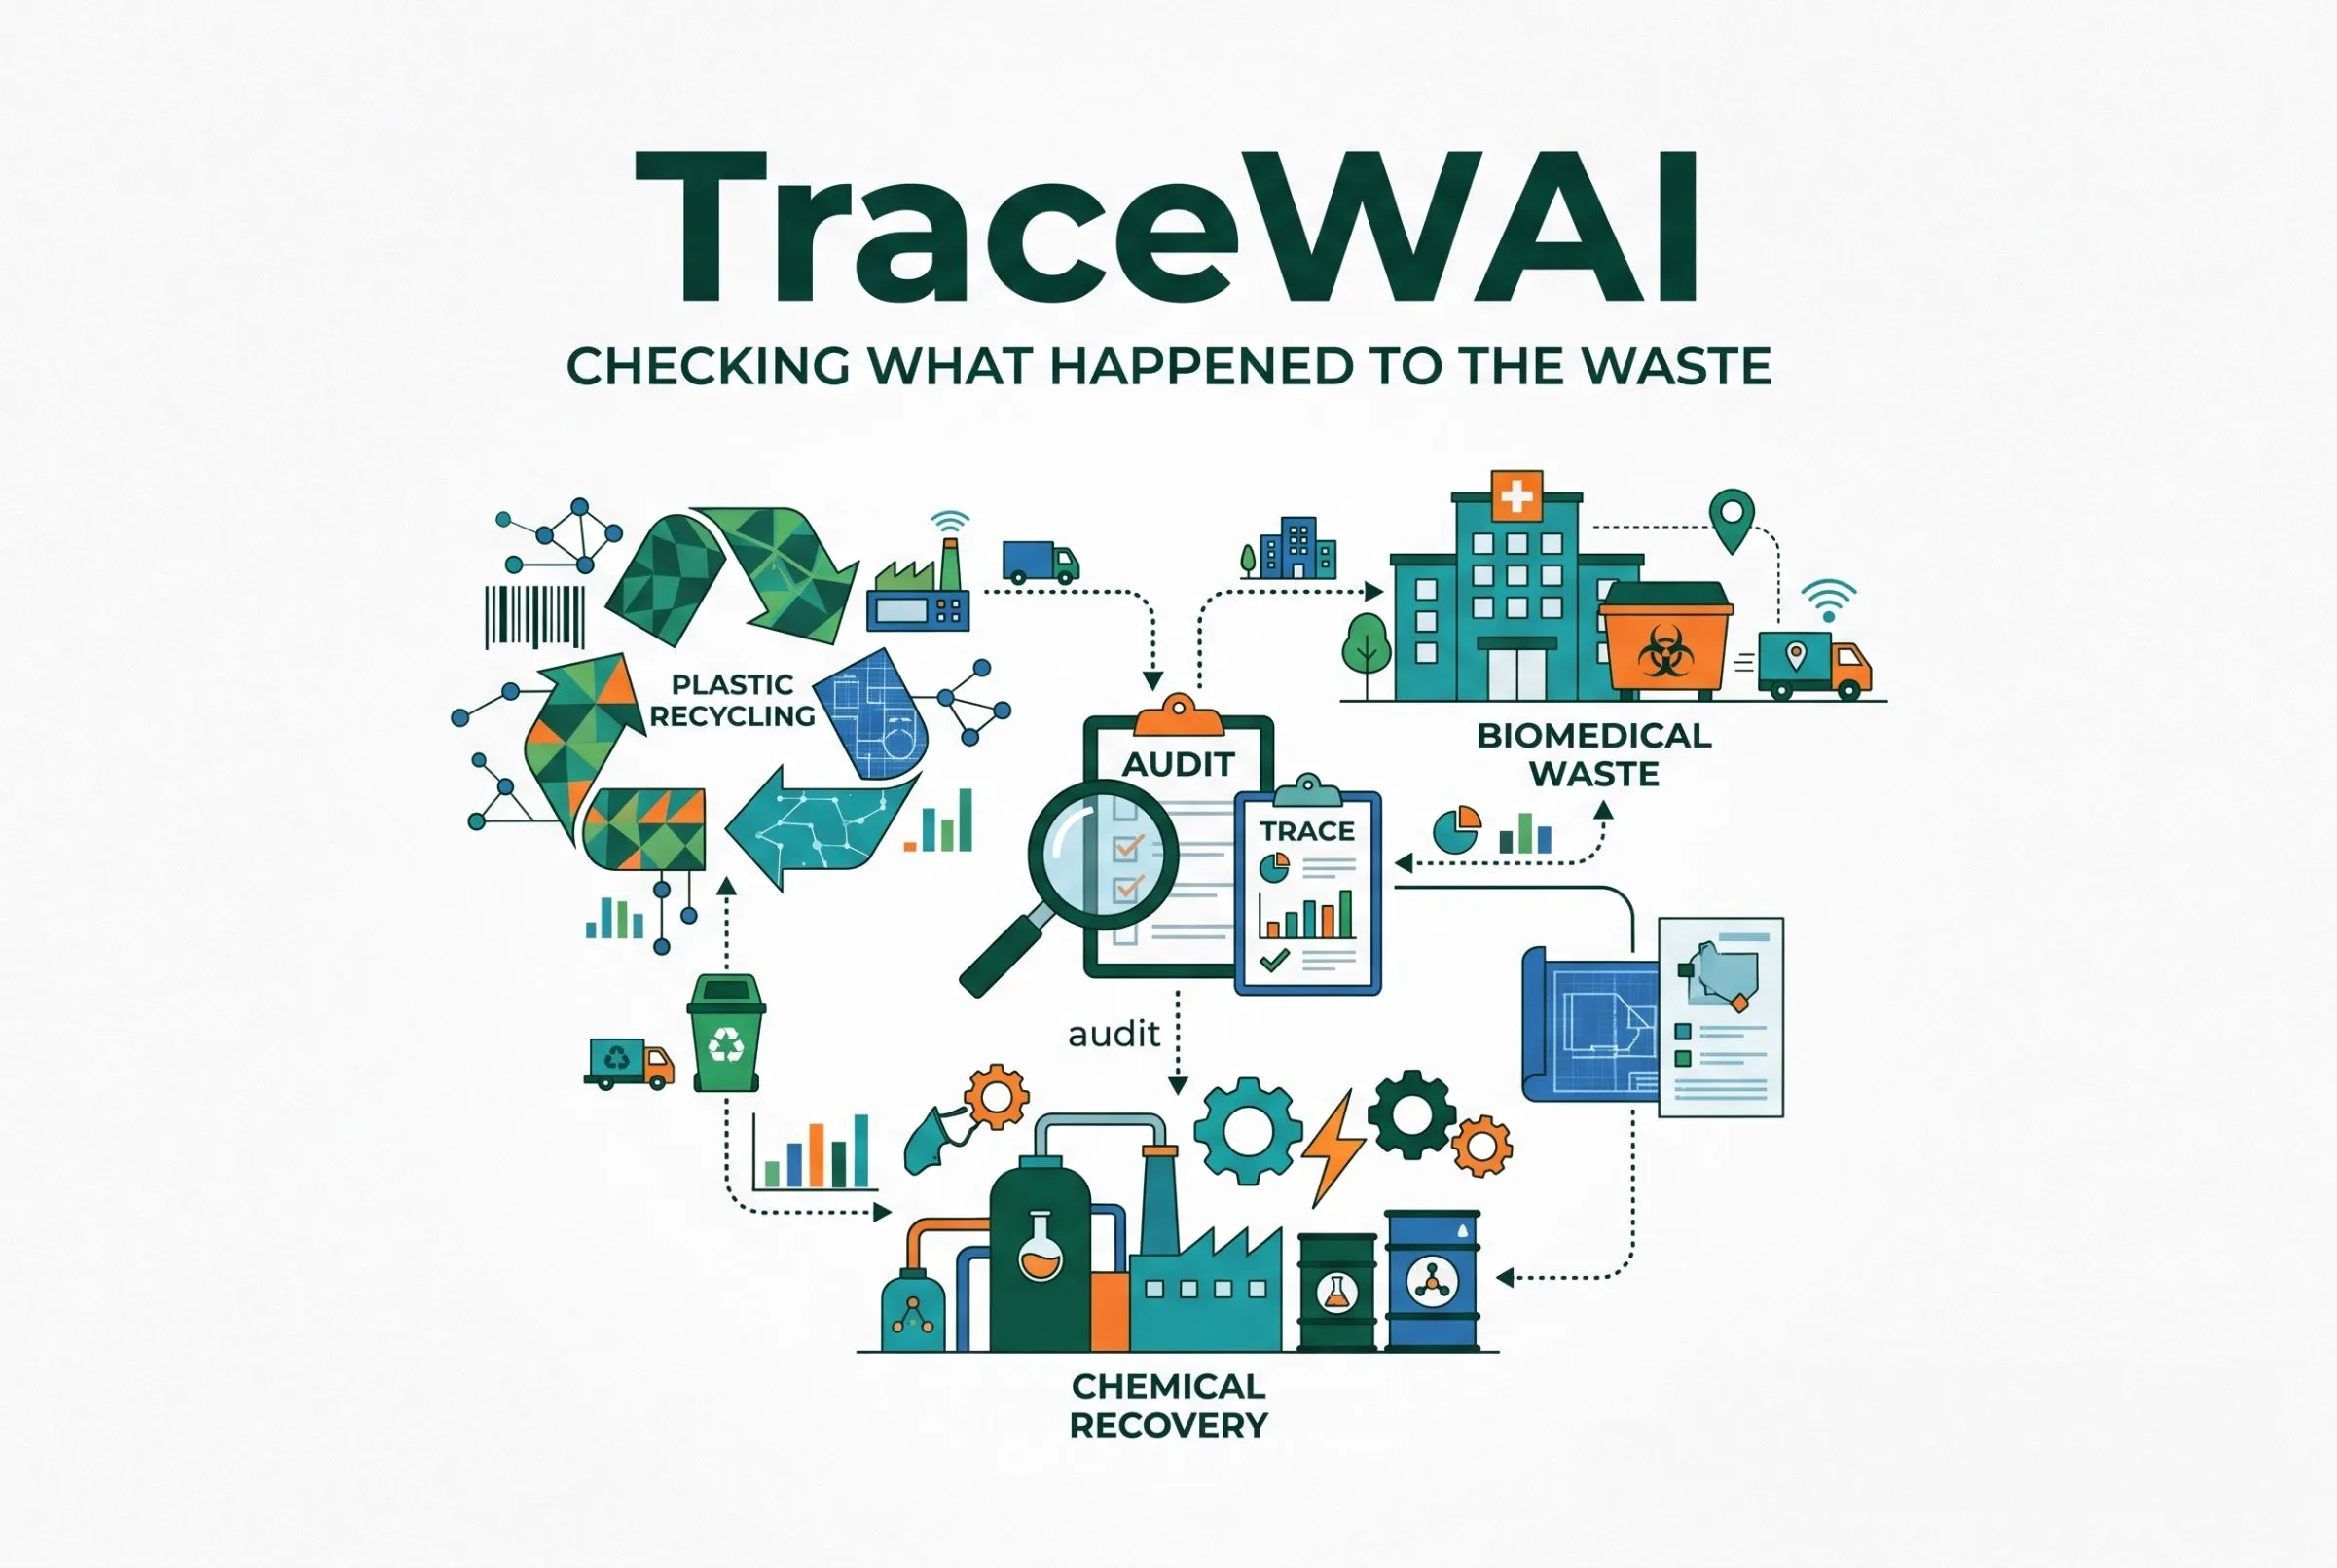
TraceWAI: Checking What Happened to the Waste
TraceWAI is an AI powered platform for auditing plastic recycling, biomedical waste, and chemical recovery. It cross-checks reported claims against electricity use, material outputs, collection records, and plant capacity to flag inconsistencies. A unified dashboard helps inspectors prioritise cases and review the evidence behind each finding.
Student
TraceWAI: Checking What Happened to the Waste
When we started building TraceWAI, we kept coming back to one problem. A record can say that waste was recycled or treated, but an inspector still needs a way to check whether the numbers make sense.
Take a recycler that reports processing hundreds of tonnes. You would expect some evidence of that work in its electricity bills, plant capacity, and material sales. Or take a hospital that records regular waste pickups. Those pickups should fit the hospital's activity, the collection vehicle's location, and the treatment plant's records. Looking at any one record gives you only part of the picture.
We built TraceWAI for Environmental Hacks, part of Bharat Builds 2026 by WeMakeDevs in collaboration with AWS. It brings three audit modules into one application: Phantom Plastic, Biomedical Waste Gap, and Mass Balance and Yield. The idea is to help an inspector decide which cases to look at first and then see exactly why a case was flagged.
Before getting into the results, there's an important detail about the project. We generated the datasets ourselves and deliberately added suspicious patterns. We knew those patterns when building the detectors. The results tell us how the prototype handles that test setup. We still need to find out how it performs on real regulatory data.
Three audit modules
Plastic recycling
Phantom Plastic looks at recycling certificates and the activity behind them. It uses 30 rules to check things such as electricity consumption, capacity, pricing, and transaction patterns. An Isolation Forest adds an unsupervised view of unusual combinations, while a graph autoencoder examines connections between recyclers, collectors, offtakers, and brands.
The output is a list of recyclers to review, with reasons and supporting records for each case. We also trace certificate purchases to show which brands may be exposed to a suspicious recycler. That estimate depends on assumptions documented in the repository, but it gives the reviewer a way to follow a finding through the transaction network.
Biomedical waste
The biomedical module deals with a different problem. A hospital generates waste between collections, so checking each pickup in isolation isn't enough. We compare the amount collected with the facility's activity since the previous pickup, allowing for declared closures and changes in capacity.
We also check whether the pickup itself is plausible. Was the facility closed? Was the recorded vehicle location too far away? Was the stop unusually short? Do the weights appear to have been copied? At the treatment plant, we compare reported burning with equipment and permit limits.
Some of the useful decisions here were small ones. Missing GPS data, for example, doesn't automatically mean a pickup was invented. Collection systems can lose a location fix. We keep that distinction in the checks rather than treating every missing field as suspicious.
Chemical recovery
Our third module covers e waste, batteries, tyres, and used oil. We call it Mass Balance and Yield, and it appears under Chemical in the dashboard. It checks whether claimed processing is supported by electricity, saleable products, connected load, and plant capacity. Each waste stream has its own energy and yield configuration.
One synthetic e waste case shows what this looks like. The recycler claimed about 3,811 tonnes over 30 months. Under our configured assumptions, the average shortfall against electricity support was 43.7%, against output support it was 39.3%, and against monthly capacity support it was 50.6%.
Those percentages are reasons to examine the case. They aren't measurements of proven fraud. The case file also makes the gaps in the evidence visible: this recycler had electricity bills for 25 of the 30 months, so five months remained unknown.
Getting these checks right takes more thought than simply comparing two totals. Products might be sold after the month in which they were processed. A plant might use stored material or run in seasonal batches. Declared solar generation can explain lower grid consumption. We account for sales lag and declared solar, while keeping the assumptions visible for review.
The Chemical dashboard also has a slider for adjusting the claimed tonnage. An inspector can reduce the claim while leaving the evidence fixed and see when it fits the available support estimates. Any inconsistency in the bill itself stays visible. Changing a processing claim doesn't fix the arithmetic on an electricity bill.
A shared Streamlit workspace
Once all three modules were working, we brought them into one Streamlit interface. The overview leads to Plastic, Biomedical, or Chemical. Inside each module, you can filter results, open a case, look through the evidence, and export a review list.
We kept each module's inspection policy separate. A score from the plastic model doesn't mean the same thing as one from the biomedical checks. What they share is a simple output structure: an entity identifier, a score, reasons, and references to the records behind those reasons.
There were practical details to get right in the shared interface. Cached results needed to include the data and run paths, otherwise switching experiments could show results from the wrong run. If one module's files were missing, the other modules still needed to open. We also kept the original standalone entry points and older routes working.
The scoring pipelines and the dashboard have different jobs. The pipelines do the analysis and save the results. Streamlit reads those results for inspection. That matters when a graph model takes several minutes to run and someone just wants to open a case file.
Hosting with Amazon EC2
For hosting, we chose Amazon EC2. Our application was already written in Python, and EC2 let us keep that setup while controlling the environment and application process. The deployment script creates a virtual environment, installs the dashboard dependencies, and starts Streamlit on port 8501.
It also runs the application in the background and saves output to a log file. Streamlit needs to listen on the instance's network interfaces, and the security group needs to allow access to the application port. These are straightforward steps, but they're part of making a local application accessible to someone else.
At the time of this writeup, the public EC2 instance serves the earlier Plastic and Biomedical portal. The expanded interface with all three auditors is tested locally and available in GitHub. Updating the instance to that version is the next deployment step.
We checked the dashboard in a fresh environment containing only its runtime dependencies. All three modules opened without PyTorch or the AWS SDK packages. That confirmed we could serve the saved findings without installing the entire model development stack.
The EC2 setup is a hackathon deployment. Before using it with real records, we would add HTTPS, authentication, monitoring, and a supervised service that restarts the application if it stops.
The serverless and AI extensions
We also wrote a serverless API design using AWS SAM. In the Phantom Plastic template, S3 holds detailed case files, DynamoDB holds compact signals, and Lambda retrieves them through an API Gateway HTTP API. Another application could request a ranked list or a case without rerunning the models. The current ranking endpoint scans and sorts the signals, so that approach would need work as the dataset grows.
For explanations, we added an optional Amazon Bedrock integration. It takes the existing case evidence and is asked to produce a short briefing about what the records show and what to verify first. A template provides a readable summary when Bedrock is unavailable. We would still need to evaluate how faithfully the generated text follows the evidence.
The chemical module also has Amazon Textract bill extraction adapters and evidence tools wrapped for the Strands Agents SDK. We tested its parsing fixtures, tool wrappers, and template fallback offline. Live OCR, Bedrock calls, and the serverless deployments still need testing in an AWS account. They are extensions to the working dashboard, with their status documented in the repository.
What we tested
We tested the application and the detection results separately. A page opening correctly tells us something useful, but it doesn't tell us whether a model's ranking is accurate.
The final application test run passed 63 automated tests with no failures or skips. We also completed 99 dashboard reruns across controls and both chemical test worlds. Browser checks covered navigation, a phone width of 390 pixels, and a CSV export whose 2,050 rows matched the saved chemical ranking. We reran the existing pipelines and checked their outputs when adding the third module.
On the held out synthetic dataset, Phantom Plastic achieved a ROC AUC of 0.996, and all of its top 100 ranked recyclers were planted fraud cases. Biomedical ghost pickup recall was about 95.1%. The full biomedical baseline pipeline processed 4.65 million pickups in about 20 seconds locally.
The chemical module achieved a pooled ROC AUC of 0.898 on its held out dataset. All 57 priority cases were planted fraud cases, and generating scores took about 12.3 seconds locally. Those runtimes were measured on our local machine, not on EC2.
What still needs work
There were also results we weren't happy with. Chemical missed its subtle fraud AUC target on both test worlds and missed the held out moderate screening recall target. Removing the extra drift, mix, and price signals slightly improved AUC. We documented that result and kept the weights unchanged after viewing the held out evaluation.
Biomedical screening had its own tradeoff. The broader queue caught more planted cases, but its precision was about 20%. That makes it useful for desk review, where a reviewer can request more information. Sending every case straight to enforcement would be a poor use of that queue.
The next step
Working through these results helped us be more specific about what TraceWAI should do. It should help a reviewer find a discrepancy, understand the calculation, and identify the records worth checking. It should also show when the evidence is incomplete or when a finding depends on an assumption.
Our next step would be a small pilot with domain experts and real records. We would validate the energy and yield references, check false positives among legitimate operators, and measure how many useful cases an inspector finds within a fixed review budget.
Final Thoughts
Amazon EC2 gave us a straightforward way to host a unified Python dashboard without completely changing our application architecture.
For student developers building Streamlit-based machine learning projects, it is a useful introduction to practical cloud deployment.
Our biggest takeaway from Bharat Builds was that a good AI prototype needs more than accurate models.
It needs an accessible interface, repeatable deployment, and infrastructure that supports its intended users.
Deployment Script: deploy_ec2.sh
Built for: Bharat Builds 2026 by WeMakeDevs
#AWS #AmazonEC2 #Streamlit #Python #CloudComputing #Deployment #BharatBuilds #WeMakeDevs
Enjoyed reading this content? Let the author know!
Your likes, comments, shares, and saves help creators reach more builders.

Loading recommendations
Loading article