
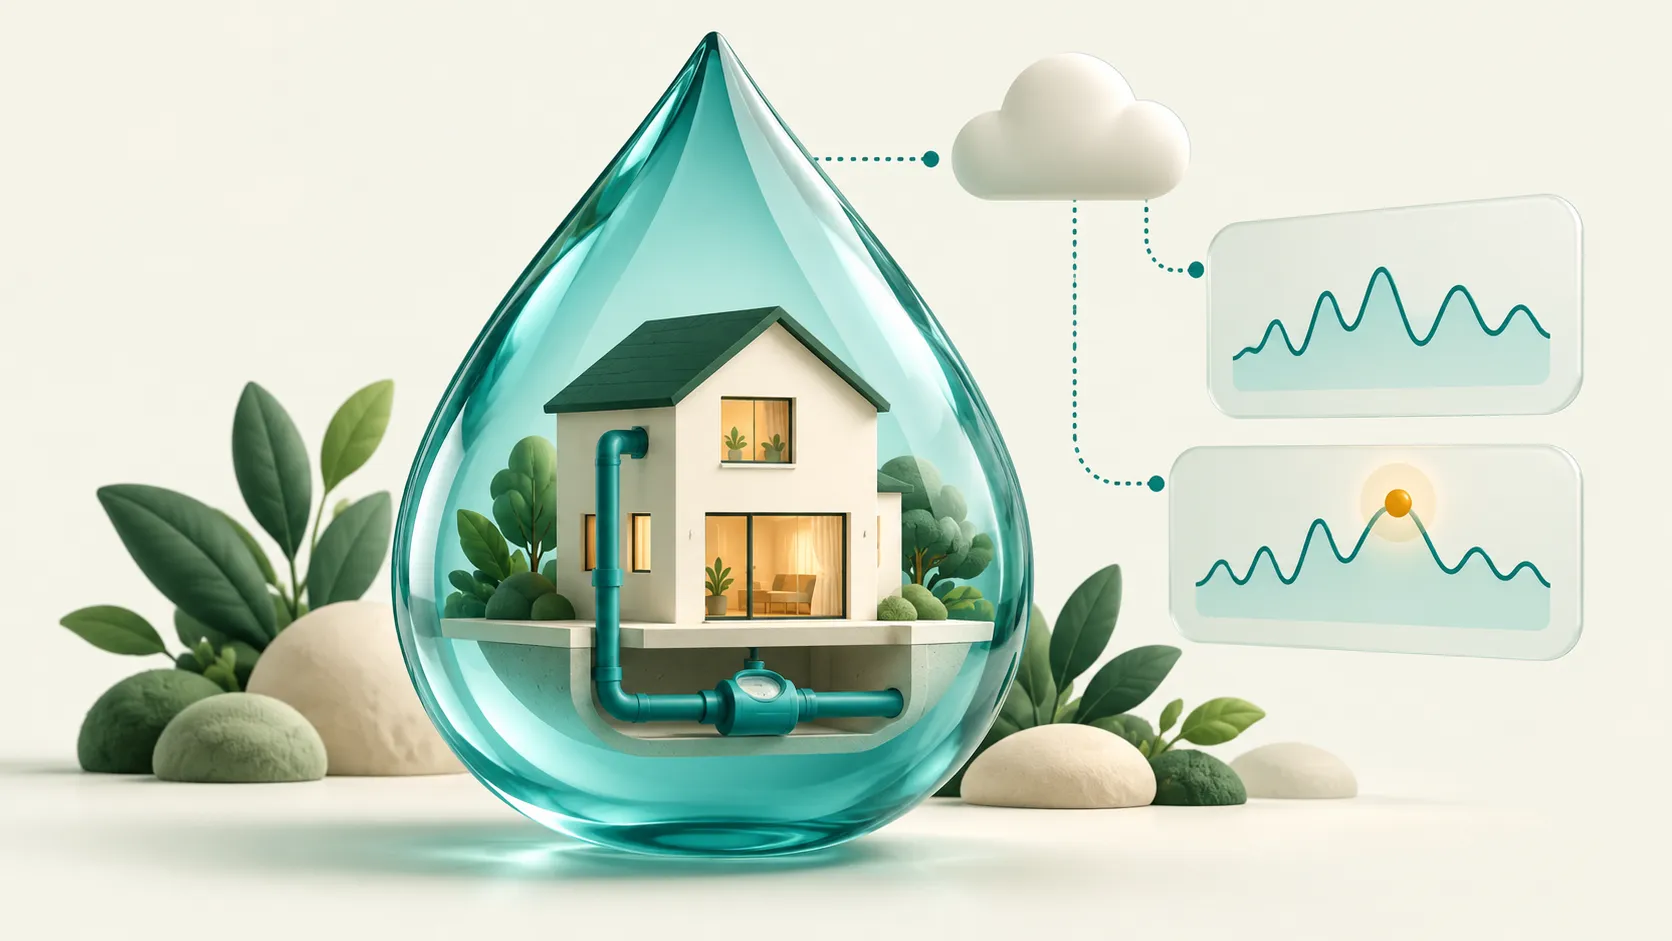
LeakLens: Turning Water Meter Readings into Something We Can Act On
How we built a water monitoring prototype that flags unusual usage, tracks maintenance, and compares readings after a repair. A practical look at machine learning, Amazon S3, DynamoDB, and SES, including what worked and what we learned along the way.


A water meter can tell you how much water you used.
It usually cannot tell you why.
A higher reading might mean someone did the laundry, guests stayed over, or a tap was left running. It might also mean there is a leak quietly continuing behind the scenes.
That uncertainty became the starting point for LeakLens, our project for the Environmental Hacks hackathon. We wanted to help people move from “this water usage looks strange” to a useful next step: investigate it, record what happened, and check the readings after a repair.
Because finding an unusual pattern is useful. Helping someone respond to it is where the project starts to matter.
LeakLens is a web application that analyses household water readings recorded every 15 minutes. Users upload a CSV file, and the dashboard shows consumption totals, a daily chart, missing readings, and suspected leak episodes.
We chose a file upload workflow so we could build and test the complete experience with available data. The current prototype works with uploaded readings; connecting live meters is a future step.
Once a file is uploaded, the idea is simple: make the data understandable without asking someone to become a data scientist first.
You can move across the chart and immediately see the time, recorded litres, and alert information. A separate day details page lets you enter a date and review that day’s consumption, data coverage, and related alerts.
We also kept missing readings visible. A missing reading does not mean zero water was used. Treating those two things as equivalent would make a tidy chart, but a misleading one.
The detection system uses an Isolation Forest, a machine learning model that identifies patterns that differ from the data it learned from. Our features include current consumption, recent usage, and time patterns.
An unusual reading alone does not automatically become a leak alert. LeakLens also checks whether unusual behaviour persists across consecutive intervals and whether water continues flowing.
That distinction matters. A shower can produce a spike. A suspected leak is often more interesting because the flow keeps going.
Even then, the website calls these suspected leaks. It cannot inspect a pipe through a CSV file, although that would have made an impressive hackathon feature.
A person still needs to investigate.
That led us to the maintenance workflow. From an alert, a user can create a ticket, record an investigation, and add a finding such as a confirmed leak, normal activity, or an undetermined result. These findings are explicitly user reported.
After a repair is reported, the user can upload readings to follow up. LeakLens compares complete windows of 24 hours before and after the repair time and shows how consumption and alert activity changed.
This was one of the most useful decisions in the project. We did not want the experience to end with a warning on a dashboard. We wanted the warning to lead somewhere.
The interface also includes household profiles, a notification inbox, browser notifications, and downloadable reports. We eventually separated these into different pages because putting every feature on one long screen made the application harder to explain, and harder to use.
Underneath the interface, React handles the website and FastAPI runs the Python backend. The data preparation and model work use pandas and the scikit learn library.
AWS gives the application persistent storage and email delivery.
Amazon S3 stores saved analysis results and generated household models in a private, encrypted bucket.
Amazon DynamoDB stores maintenance tickets, household profiles, notification records, and settings.
Amazon SES sends email alerts to the configured recipient.
We connected these services through the AWS SDK for Python, Boto3, and used the AWS CLI for local authentication. The application runs with a limited IAM user and temporary credentials, with permissions scoped to its resources.
The website currently runs on our laptop while using those real AWS services. Public cloud hosting is a separate next step.
We tested the integration by saving data, restarting the backend, and checking that the analysis, tickets, repair comparisons, and household information were still available. We also confirmed that an SES alert actually reached the inbox.
That last part felt particularly satisfying. A successful API response is reassuring. Seeing the email arrive is better.
Of course, getting there involved a few interruptions.
Account verification delayed our first attempt to use CloudShell. Then we had to work through regions, permissions, email verification, and getting the Python application to use the correct AWS login profile.
Later, an expired AWS session interrupted the website’s access to its stored data. The frontend still appeared, but the application could not load what it needed.
It was a useful reminder that a page loading successfully and a system working successfully are two different milestones. Renewing the session and verifying the backend restored the connection.
We also spent time on smaller issues that turned out to matter during a demonstration: making chart details appear immediately, giving ticket creation a clear result, and preventing repeated uploads from sending the same notification again.
None of those features sounds especially dramatic. All of them make the project more usable.
For evaluation, we used chronological training, validation, and test periods. The detector settings were fixed before evaluating the reserved test data.
In four selected scenarios, we added continuous water flow at rates between 0.25 and 2 litres per minute. The model detected all four, with delays between 75 and 105 minutes.
A simple rule based on continuous flow detected those same scenarios faster. That result deserves to stay in the story.
The model produced fewer alert episodes on the original test readings: two compared with sixteen from the simple rule. But those readings do not have confirmed leak labels. We therefore cannot call those counts false alarms or claim an accuracy percentage for real leaks.
For the repair demonstration, we created a separate synthetic example with an added flow of one litre per minute, then removed that flow at the reported repair time. The comparison showed alert intervals falling from 90 to zero.
It demonstrates the workflow. It does not establish measured water savings or prove that a physical repair happened.
There is still work ahead: testing against labelled real leak data, improving validation across more households, adding user access controls, and making email processing more resilient. Live meter integration would also make the system more useful beyond a prototype that uses CSV files.
But the current version connects several things that are often presented separately: readings, unusual behaviour, human investigation, and repair checks.
That is what we wanted to build.
LeakLens helps a user notice a pattern, understand why it deserves attention, and keep a record of what happened next. The environmental value would come from using that information to investigate persistent water loss earlier, and eventually measuring whether those interventions helped.
You can explore the implementation in our GitHub repository . The project uses the attributed Smart Meter Water Consumption Measurements dataset , available under CC BY 4.0.
Enjoyed reading this content? Let the author know!
Your likes, comments, shares, and saves help creators reach more builders.

Loading recommendations
Loading article