
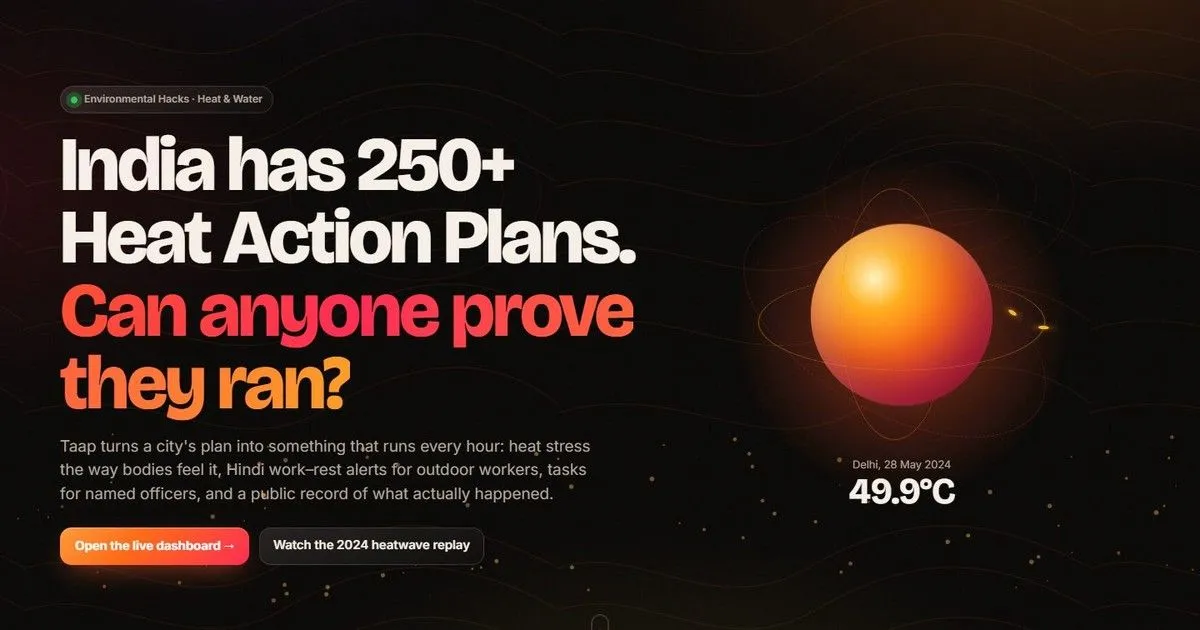
Delhi's heat plan said green. Our model said 15 minutes of work per hour.
Most Indian Heat Action Plans warn on temperature alone and leave no record of what happened next. We built Taap to run Delhi's plan every hour on WBGT heat stress, alert outdoor workers in Hindi, task named departments and keep a public ledger, with the AI parts built on Strands Agents.


On 28 May 2024, the India Meteorological Department recorded 49.9 °C at Mungeshpur and Narela in north Delhi. Delhi has a Heat Action Plan. So do Ahmedabad, Jaipur, Hyderabad and most large Indian cities; the NDMA counts more than 250 of them.
So here is a simple question. On that day, did Delhi's plan actually run? Which water points opened, which construction sites stopped heavy work, who did it, and when?
As far as we could find, nobody can answer that. Most plans are PDFs. They warn the whole city based on the day's maximum temperature, and once the warning goes out there is no public record of what happened next. One review we read could not even find the current Delhi plan on a government portal.
For Environmental Hacks (Heat and Water track) we built Taap (ताप, Hindi for heat) to change that. It takes a city's plan, turns its rules into code, runs them every hour, and keeps a public ledger of what each department was asked to do and whether it did it.
The thermometer is the wrong instrument
Plans trigger on maximum temperature because that is what forecasts headline. But the body does not feel air temperature. It cools by sweating, humidity stops sweat from evaporating, and direct sun adds heat on top. That is why occupational standards use WBGT (wet bulb globe temperature), which combines temperature, humidity, wind and solar radiation.
Here is what that looks like in practice. While writing this post on 11 October, Delhi's maximum was about 30 °C and the city's plan tier was green. Our modelled WBGT for Narela was 29 °C between 10 in the morning and 1 in the afternoon. For heavy, acclimatised work, the ACGIH screening limits at that level allow 15 minutes of work and 45 minutes of rest each hour. Nobody gets a warning on a green day.
Taap computes hourly outdoor WBGT for every zone with the Liljegren (2008) model, using Open-Meteo forecasts. We deliberately did not use the "simplified WBGT" formula that only needs temperature and humidity, because it overstates heat stress in humid air and we did not want to cry wolf.
We keep two scales side by side:
Worker band | WBGT | Heavy work guidance |
|---|---|---|
0 | below 25 °C | Normal work |
1 | 25 °C | 45 min work, 15 min rest |
2 | 27.5 °C | 30 min work, 30 min rest |
3 | 29 °C | 15 min work, 45 min rest |
4 | 30.5 °C | Stop heavy work |
The plan tier (green, yellow, orange, red) still comes from the city's own temperature thresholds, so departments are tasked exactly the way their plan says. The worker band comes from WBGT and decides what each worker is told. New workers, in their first two weeks, get the stricter limits ACGIH sets for people who are not yet acclimatised.

What happens every hour
- Fetch the forecast for every zone and compute WBGT.
- Work out the plan tier and the worker band per zone.
- Create the plan's actions ("set up drinking water points at labour chowks in Narela, 10:00 to 17:00") and send each one to the officer of the department that owns it, with a Done button.
- Alert subscribed workers on Telegram, in Hindi or English: when to stop, how often to drink, and to call 112 for fainting or vomiting. Alerts go out once per band per day and never at night.
- Workers can report back with one tap: no water, no shade, work not stopped, someone unwell. The report goes to the right department, and the officer resolves it.
- Everything lands on a public ledger: per department, how many actions were assigned, how many were done, and the median time to confirm.

Two more pieces reach people without smartphones: a CAP 1.2 alert feed (the format India's SACHET system uses) and printable Hindi posters for labour chowks. There is also Saathi, a voice assistant for workers that answers in Hindi: how risky today is, where the nearest water and shade are, and when it is safe to work.

Where AWS fits
The AI parts are built with Strands Agents, the open source agent SDK from AWS. There are three agents: the officer's plan assistant, Saathi for workers, and an importer that drafts a new city's config from its Heat Action Plan PDF.
What we liked about Strands is how little ceremony a tool needs. A tool is a Python function with a docstring:
Python
@tooldef zone_risk(city: str, mode: str = "live") -> str:"""Today's heat risk per zone: plan tier, WBGT peak, worker band, risky window, hot-night flag."""
The agent reads live state through these tools, so when an officer asks "which zones still have open actions?" the answer comes from the database, not from the model's imagination.
The most important design decision was what the model is not allowed to do. It never decides an alert or an action. Those come from fixed plan rules that anyone can read on the Plans page, each with the clause of the plan it comes from. The agents only answer questions and file reports. Saathi goes one step further: if someone describes fainting, vomiting or confusion, the message never reaches the model at all. It gets fixed first aid steps and the 112 number.
Swapping models was one line. For the demo the agents run on Groq through Strands' OpenAI-compatible provider. The AWS build uses Amazon Bedrock.
The AWS deployment is an AWS SAM template:
- EventBridge Scheduler runs the plan every hour, in the Asia/Kolkata time zone
- Lambda functions with function URLs serve the Telegram webhook, the dashboard and the API
- DynamoDB holds snapshots, actions, reports and the alert log in a single table
- Amazon Polly turns alerts into Hindi voice notes
- Amazon Bedrock runs the agents
We are honest about one thing: for the hackathon we submitted the Build It version. The same code runs on one machine with SQLite and Telegram long polling, and the live demo is hosted on Render and Vercel. The SAM template is ready, but we did not deploy it for the demo.
Replaying May 2024
A heat plan is only worth something if it would have fired in time, so we replayed the 2024 Delhi heatwave (15 May to 20 June) through Delhi's rules using ERA5 reanalysis data.
- The first worker warning came on 15 May, the first day of the window and 13 days before the 49.9 °C peak.
- The plan reached orange or red on 23 of the 37 days.
- Across 14 zones it would have created 1,554 department actions.
- Nights stayed dangerously warm on 212 zone-days, which the plan treats as a reason to escalate.
A caveat we print on the dashboard as well: ERA5 is a roughly 25 km reanalysis, so it reads lower than station peaks. And the famous 52.9 °C reading from 29 May was a sensor error, so we do not use it.

What broke, and what we learned
The most useful day of the hackathon was the one we spent trying to break our own app.
Saathi was lying, politely. When a worker said "there is no water at my site", Saathi replied "sent to the water department". The report was saved, but it never reached an officer. For a safety tool, saying you acted when you did not is worse than saying nothing. Reports from Saathi now go through the same path as the Telegram ones, with a test that fails if they do not.
Anyone could pad the public ledger. Viewing an old replay date computed that day on demand, and computing it created open actions. So browsing a month of replays would quietly drag every department's score towards zero. Browsed days now stay off the record until an officer acts on them.

Telegram buttons carry at most 64 bytes. When we wired Saathi's reports into the officers' Telegram, the obvious report ID (a timestamp plus the web session) would have been longer than that, and Telegram rejects the whole message when a button is too long. We caught it while writing the fix, switched to short hashed IDs, and added a test that checks the length.
Our host's IP was already over the weather API's daily limit. On deploy day, every forecast request from our backend failed with "Daily API request limit exceeded", because the IP was shared with other apps. The fix was a small Vercel function that fetches the forecast for the backend.
Models write for chat apps, not for Telegram. Answers came back with markdown tables and citation marks, which Telegram shows as raw symbols. We now ask for plain text and clean the output before sending it.
Our own design was slowing people down. A heat haze effect rebuilt an SVG filter on every frame, and the moving background behind it forced 25 blurred glass panels to redraw constantly. In our tests the dashboard managed about 19 frames per second. Removing the per-frame work brought it to around 55 to 60 without changing how it looks.
What we would build next
- Missed-call and WhatsApp alerts, because many outdoor workers use feature phones.
- Ward-level vulnerability layers, so actions go where the most exposed people are.
- Correcting the forecast against IMD station data.
- Deploying the SAM stack, with Bedrock for the agents and Polly voice notes in Hindi.
More than 250 heat plans exist in India. Very few have ever been run end to end where the public can check them. Taap is our attempt to make one plan run, and to make it checkable.
Built for Environmental Hacks by WeMakeDevs. Weather data from Open-Meteo (CC BY 4.0), maps from OpenStreetMap contributors.
Enjoyed reading this content? Let the author know!
Your likes, comments, shares, and saves help creators reach more builders.

Loading recommendations
Loading article