
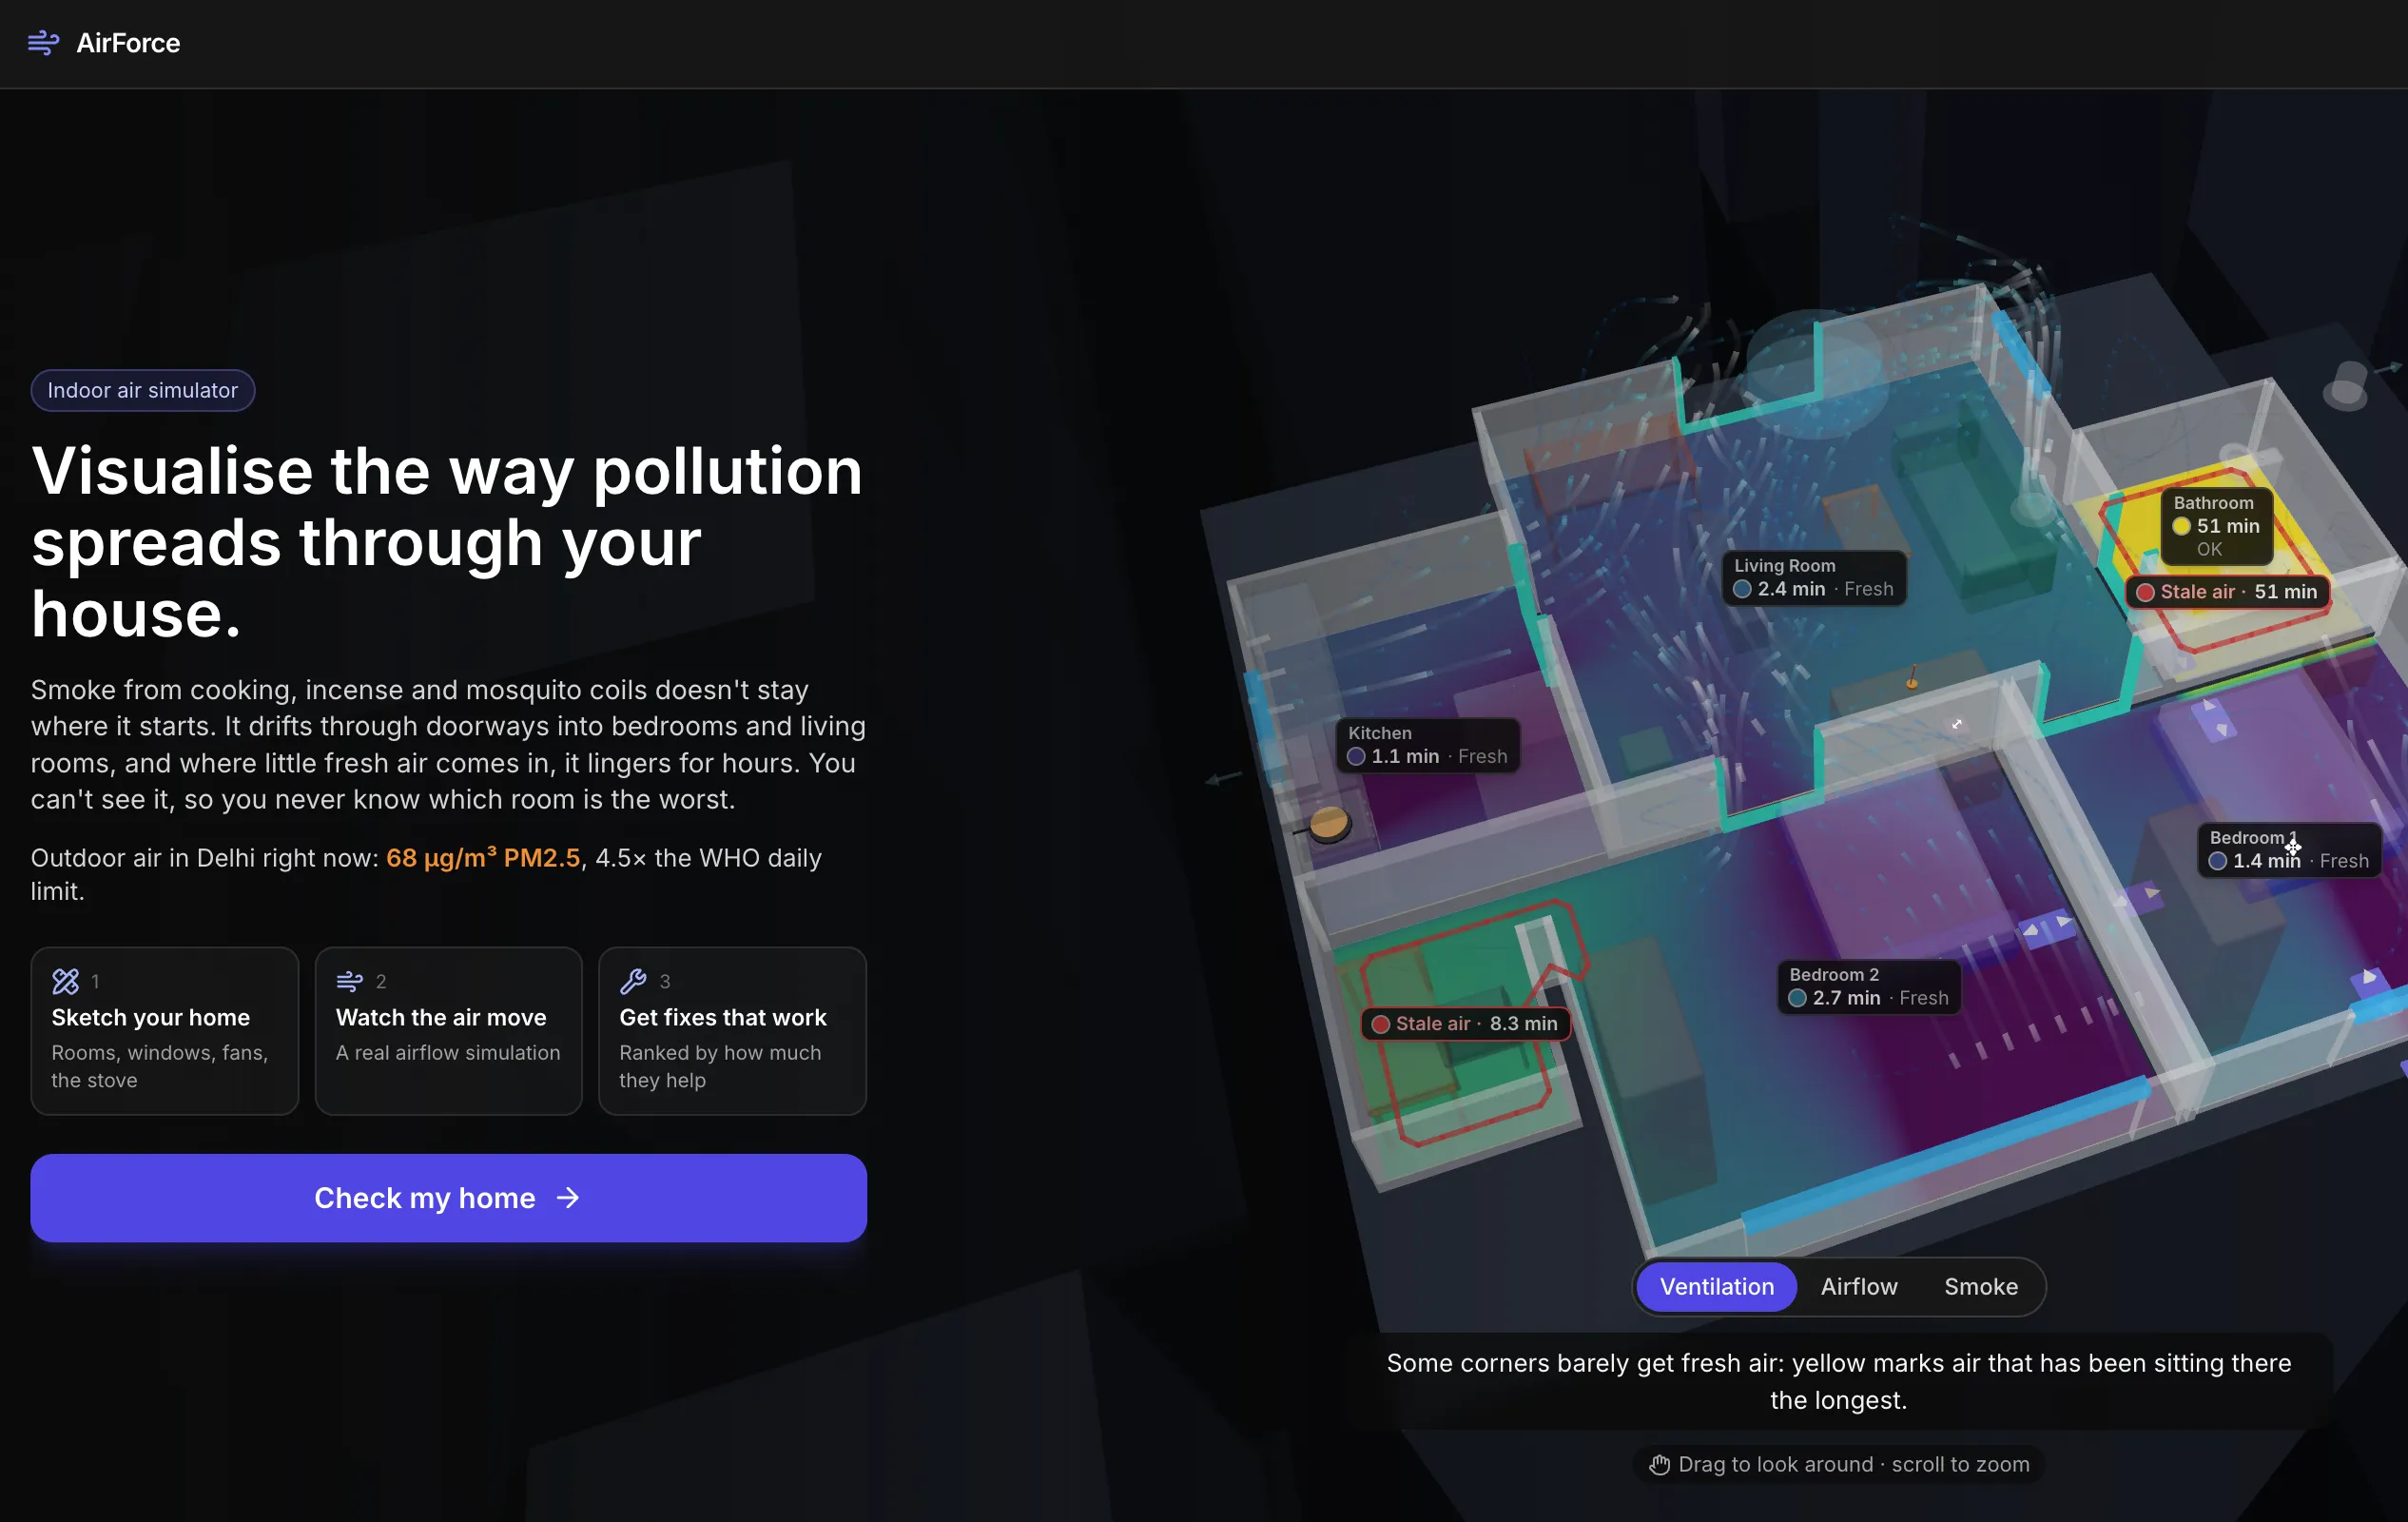
AirForce: Visualise the way pollution spreads through your house
Discover how we built AirForce, an interactive 3D web app that visualises indoor airflow, identifies stagnant air hotspots, and offers actionable room setup recommendations.



Day 1: How many Problems must one go through ?
Pointing at a problem is easy. Understanding it, breaking it down and choosing the right piece to fix is much harder. Hardest of all is building something that truly solves that piece. We started big, discussing global issues, India's rivers and Delhi's roadside pollution over a Google Meet. In the end, we realised the problem we could truly solve was one we face ourselves daily, and after a few rounds of ideas we landed on AirForce.
The idea of AirForce came from the stagnant water on the roads of Saket, where one of our members lives. While we were thinking about waterlogging, it struck us that air itself is just an invisible fluid, and that stagnant air is a problem people often overlook, understandably so, since, in summer, fans, ACs and open balconies keep a house ventilated, but in winter that same house becomes sealed. Fans are switched off, and windows and vents are shut to keep the pollution out. What we rarely consider are the pollutants already inside our homes. Without proper airflow, they tend to build up in the same spots, creating hotspots, and if one of those hotspots happens to be your bed, you could be breathing it all night. Since this affected all of our homes, we knew that what we planned to build would genuinely help us too, and that was our driving force.
Day 1.5: There's a solution in there somewhere...right?
We considered several ways to identify hotspots within a house, and all of them had one thing in common. We needed to somehow bring the layout of a room, or even an entire house, onto our site. Once that was done, we could run an airflow simulation on the layout to find where hotspots would form. However, getting the layout onto the site was a challenge.
Our first idea was LiDAR scanning, which several iPhone models can use to map a room accurately, but once we compared it with building the layout ourselves, the choice became clear.
Considerations | LiDAR scanning | Our room builder |
|---|---|---|
Who can use it | Only LiDAR-equipped iPhones | Anyone with a browser |
Cost | Paid apps to export scans | Free |
Reliability | Free apps are inconsistent | Built into our app |
Effort | Minutes of careful scanning | Drag and drop, like a game |
Accuracy | High | Good, with precise sizes still a work in progress |
So we decided we would build our own room builder, inspired by games like The Sims 4, where arranging a home feels natural rather than technical. That mattered to us because the people most affected by indoor pollution shouldn't need special hardware or a subscription just to find out where the air in their home is unhealthy.
For now, we're focusing on the builder, because the simulation is only as good as the home it's given.
Day 2: Turbulent weather close to Landing
Today had plenty of ups, but far too many downs for comfort; some would call it a turbulent day. We couldn't find a way to work on the user interface in parallel without running into constant merge conflicts, so we took turns, with one person working on the UI at a time while the rest of us planned the coming days of the hackathon. The core framework of the site, along with its default assets, came together fairly easily, but ironing out the finer details took far longer. Most of the flaws in the user experience could only be identified if we actively tested our UI with the mindset of an end user rather than a developer.
The serialised workflow we decided to follow had an unforeseen benefit. It gave us the ability to make sure the person who built a feature was never the one who tested it. Teammates who had less familiarity with the internal mechanics of a specific feature could use it the way a real user would and give honest feedback. That feedback led to some big improvements, like more intuitive controls for the 3D camera and an easier way to search for assets such as open walls or sliding doors. It also led to smaller quality-of-life fixes, like attached items moving along when a wall is dragged to resize a room, and copy-paste shortcuts so assets don't have to be dragged in again and again. A good interface should feel intuitive, and we weren't there at first. Our first version already had most of the assets we needed, but as the picture below shows, it was far from easy to use.

Our first UI. Everything was there, but very little of it was obvious.
After several rounds of this back-and-forth testing, the UI finally reached a presentable state, good enough that every one of us could recreate our own apartment accurately. It still needs some refinement, and if time allows, we'll fix a few more details and minor bugs and keep playtesting, but for now we've moved on to the airflow simulation.
All-nighters for the win!
Day 3: Answer Is Blowing in the Wind
Going into the airflow simulation phase, we knew we had our work cut out for us. Simulating air means dealing with a huge number of variables, such as which floor the home is on, what surrounds it, the type of windows, ventilation, ceiling fans and much more.
Our first hurdle was asking users for all of this without making it feel like a form. So we refined the UI once again, spacing the questions out and giving users a visual reward each time they answered. We added dynamic scenery that responds to their choices. Picking a floor level lifts the 3D view to that height, and choosing a densely built-up area fills the background with buildings to match.
To see whether these details actually mattered, we ran the same home on two different floors. Everything else stayed identical, with nearby buildings, sliding windows and outdoor PM2.5 at 60 µg/m³.

The home on the 2nd floor, in the Ventilation view.

The same home on the 12th floor.
The numbers below show the age of the air in each room, meaning how many minutes, on average, since it last came in from outside. Lower means fresher.
Room | 2nd floor | 12th floor |
|---|---|---|
Bedroom 1 | 2.0 min | 1.3 min |
Living room | 3.0 min | 1.9 min |
Bedroom 2 | 3.2 min | 1.7 min |
Higher up, the wind is stronger, so fresh air reaches every room faster. The stalest corner stays at 51 minutes on both floors, though, because a closed-off space doesn't benefit from wind it never receives.
We gathered the other inputs through similar small interactions. Opening a window shows it swinging open, and placing a stove in the kitchen shows it cooking. Details like these made us think about the app from the user's side, which pushed us to solve problems the way a real household would experience them.
However, that was only part of the equation. We also needed to simulate the airflow itself, which we did using three distinct models.
- The room box treats each room as one well-mixed space. It tells us how much pollution a room holds over time.
- The room network connects rooms the way building engineers do, so air flows from higher to lower pressure through doors, windows and gaps. It's fast enough to update every time you move something.
- The 3D grid splits the home into 20 cm cubes to show where air goes stale, like behind a wardrobe or right over a bed. It runs entirely in your browser, with no server involved.
Every one of these models needs real-world numbers to work with.
What the simulation needs | Value we use |
|---|---|
How easily air passes through an opening | 0.60 |
Wind reduction in a dense city | K = 0.21, a = 0.33 |
Airflow from a ceiling fan | at least 210 m³/min |
Airflow lost to an insect mesh | about 25% |
How fast fine dust settles indoors | 0.20 per hour |
Pollution source | Fine dust released per minute |
|---|---|
Frying on a gas stove | 1,700 µg |
Mosquito coil | 1,500 µg |
Cigarette | 1,400 µg |
Roti on a tawa | 600 µg (our estimate) |
Incense (agarbatti) | 400 µg |
Boiling on a gas stove | 300 µg |
Sweeping | 300 µg |
Candle or diya | 80 µg |
If you skipped those tables, you're not alone. Most people do, and honestly, why would anyone read a list of numbers? But we didn't just read them, we built everything on them. These values are the reason a red room on your screen means something real instead of being a guess dressed up in colour, and leaving them out of this story would have been a disservice to the work behind it. We took them from British ventilation standards, Indian fan standards and published studies on cooking, incense and dust. Where no measurement existed, like the smoke from a roti on a tawa, we estimated it and said so.
Then we tested it against cases with known answers, like a sealed room with a candle or a purifier in a closed room, and comparing our simple and detailed models on the same homes caught two real bugs, one that made rooms 19% larger than they were and another that stopped kitchen smoke from drifting through an open door on still days, neither of which we would have spotted just by looking at the screen.
So, back to our question from Day 1: does the exact gap between your bed and wardrobe matter? A little, since furniture does redirect air. What matters far more is what happens in a real home, like how much smoke your cooking produces or how leaky your windows are. Day 3 pulled in every part of our team and taught us how much testing matters, and on Day 4 we turn to fixing the last bugs and putting AirForce online.
Day 4: The Times They Are A-Changin'
We were finally able to work in parallel; times do change for the better. Half of our team focused on hosting and deploying the web application, while the other half worked on video production and remaining administrative tasks.
We did not want the AWS integration to be cosmetic, something that exists only to tick the eligibility box, so every service had to earn its place. The first and most obvious requirement was hosting because users need to see the app working for themselves. We therefore deployed it on AWS Amplify, which rebuilds the app from GitHub every time we push a change. We also wanted the simulation to reflect the real air outside instead of relying only on preset values, so we added a "Live" button that calls our own API built with API Gateway and Lambda. It returns the current PM2.5 levels along with the wind and temperature at the user's location. Now, since outdoor conditions do not undergo drastic change from one second to the next, DynamoDB caches each answer for 30 minutes instead of asking the data provider the same question again. The entire backend is defined in a single AWS SAM template and can be deployed with one command, and each function's IAM role can reach only the resources it genuinely needs. Some decisions were less obvious and meant weighing what a service would add against what it would cost us. We considered user accounts with Amazon Cognito so that designs could be saved to the cloud, but designs already save in the browser and export as files, and asking people to sign up before they could even try the app felt like the wrong trade. We also thought about running the solver on AWS, but it already finishes in a few seconds in the browser. So moving it would only have added cost and waiting time without making the air quality advice any better.
The video came together on the final day, but it was born on the first, in the same conversation that gave us AirForce. Ideas for it were never in short supply; only minutes were, and with just three of them we had to be ruthless about what stayed. We chose to show why this problem matters, what we built, how the simulation works and where AWS powers it. Most of all, we wanted it to shine a light on something nobody ever looks at, because the pollution that reaches you most isn't on the street outside; it's in the room where you sleep.
Final Thoughts
Four days, each with its own purpose, and each asking us to look at the same problem through a different lens. We were builders and we were users, but more than anything we were convinced that what we were making was useful, needed and, honestly, a lot of fun. Every feature, every number and every service had to fight for its place, and the ones that stayed earned it.
Enjoyed reading this content? Let the author know!
Your likes, comments, shares, and saves help creators reach more builders.

Loading recommendations
Loading article