
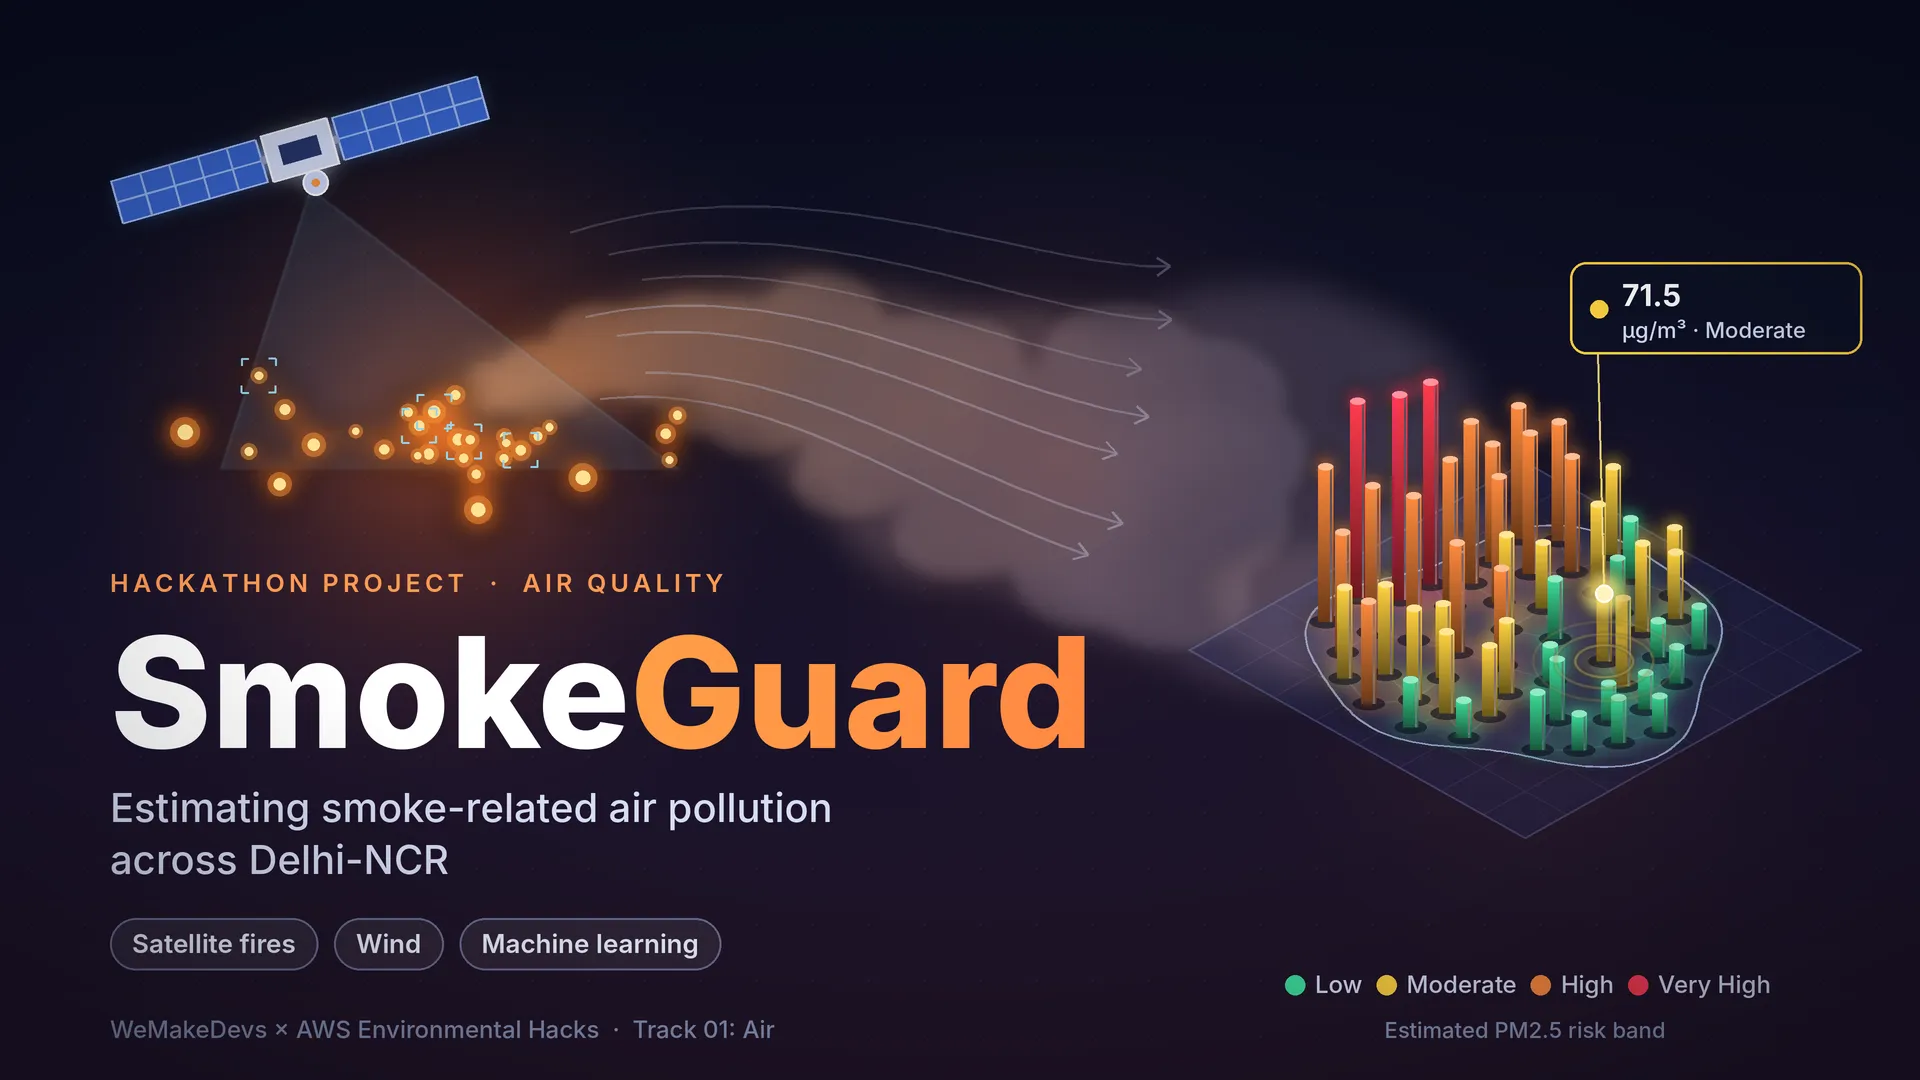
SmokeGuard: Estimating Smoke-Related Air Pollution Across Delhi-NCR
A hackathon project that estimates smoke-related air pollution for 56 monitoring locations across Delhi-NCR, using satellite fire sightings, wind and past air-quality readings, and explains the result in plain language.

The problem
Every autumn and winter, many farmers in Punjab and Haryana burn the leftover stalks of their crops to clear their fields quickly. This is called stubble burning. The smoke can drift towards Delhi-NCR and make the air unhealthy to breathe.
Whether that smoke actually reaches your neighbourhood depends on a few things: where the fires are, how far away they are, which way the wind is blowing, and how polluted the air already was in the last few days.
But most air-quality updates give one number for a whole city. That is like announcing the average marks of an entire school. It does not tell you how your own class is doing. A school sitting in the path of the smoke and a school far from it can have very different air on the same day.
SmokeGuard tries to answer a smaller and more useful question: how smoky is the air likely to be near this specific place today, and what should I do about it? It is aimed especially at sensitive places such as schools and hospitals.
In simple words
Imagine someone lights a bonfire in a field. Whether you smell smoke at your house depends on three things: how close the bonfire is, which way the wind is blowing, and whether the air was already hazy this morning.
SmokeGuard does this same kind of thinking, but with data instead of your nose:
- Satellites spot fires from space, so we know where the bonfires are.
- Wind data tells us which way the smoke is likely to travel.
- Past air-quality readings tell us how smoky the air already was near each place.
A computer model learned from several years of this information and now estimates the smoke-related air pollution at 56 spots across Delhi-NCR. The dashboard then shows the estimate, explains it, and suggests what to do.

Fires, wind and distance decide how much smoke reaches a place.
A few words explained
- PM2.5: very tiny particles of dust and smoke floating in the air. They are much thinner than a human hair, so they can travel deep into the lungs. This is the pollution number SmokeGuard predicts.
- µg/m³ (micrograms per cubic metre): the unit for PM2.5. It means how much those particles weigh in one cubic metre of air. Bigger number, dirtier air.
- NASA FIRMS: a NASA service that publishes fires spotted by satellites. We use data from the VIIRS instruments on three satellites (NOAA-20, NOAA-21 and SNPP).
- Downwind fire: a fire placed so that the wind would carry its smoke towards your location.
- Machine-learning model (Random Forest): a program that learns patterns from past data. A Random Forest is like asking 300 small decision-makers (“trees”) for their opinion and taking the combined answer.
- Risk band: a simple label (Low, Moderate, High, Very High) that sorts a PM2.5 number into an easy-to-understand group.
- API: a doorway that lets one program (our dashboard) ask another program (our forecaster) a question and get an answer.

PM2.5 particles are far thinner than a human hair.
What SmokeGuard does
- Estimates PM2.5 for 56 monitoring locations across Delhi-NCR.
- Sorts every estimate into a Low, Moderate, High or Very High risk band.
- Shows a dashboard with the estimate, the risk, the latest measured value, wind, nearby fires, a plain-English explanation, and a recommended action.
- Shows how fresh each piece of data is, so you know how far to trust the result.
- Includes an interactive 3D map of Delhi and the districts around it.
- Offers a small set of web endpoints (doorways) so other programs can ask for forecasts and advice.
- Runs its predictions on Amazon SageMaker, a managed cloud service for machine-learning models.
It was built for the WeMakeDevs x AWS Environmental Hacks, Track 01 Air: Agentic Smoke Dispersion Forecaster. I registered for both the Build It track (using the Strands Agents SDK) and the Ship It track (deploying on AWS), and built the project on my own.
How it works, step by step
- Collect the ingredients. Satellite fire sightings from NASA FIRMS, air-quality readings from monitoring stations, and wind data from Open-Meteo, a free weather service.
- Turn them into useful clues. For each place and each day, the program works out: how many fires were upwind within 50, 100 and 200 km; how strong those fires were (closer and stronger fires count for more); how far the nearest one was; the wind speed and direction; and the PM2.5 readings from 1, 3 and 7 readings ago. Fire clues use the previous day’s fire sightings.
- Teach the model. All of this was combined into one big table of 62,154 station-days (one station on one day) from 56 stations, covering 8 October 2020 to 15 December 2025. The Random Forest learned how those clues relate to the PM2.5 that was actually measured.
- Put the model in the cloud. The trained model was packed into a container (a sealed box that runs the same way anywhere), stored in Amazon ECR, and deployed on a SageMaker Serverless endpoint. “Serverless” means there is no machine running all day; it wakes up when asked.
- Ask for a forecast. When you pick a place on the dashboard, a small Python service (built with FastAPI) gathers the latest readings, the current wind and the stored fire clues, sends them to the cloud model, and gets back a PM2.5 estimate.
- Explain it. The estimate is turned into a risk band and a plain-English explanation. The recommended action comes from simple written rules.
- Show how fresh the data is. The dashboard lists how old the PM2.5 reading, the weather, the fire detections and the calculated clues are.
What’s inside the data
- Fires: NASA FIRMS (VIIRS) detections from NOAA-20, NOAA-21 and SNPP, 133,228 historical detections for a region covering Punjab, Haryana and Delhi-NCR (roughly longitude 74.5 to 78.5 and latitude 27.5 to 31.5).
- Air quality: historical records from 2020 to 2024 (from XKDR) and current readings from 2024 to 2025 (from monitoring-station datasets, including CPCB-related observations).
- Wind: from Open-Meteo.
- Today’s inputs: a few small files the system refreshes, such as the latest PM2.5 readings, near-real-time fire detections, today’s wind and the list of monitoring locations.
The risk bands are the project’s own groups, not official air-quality categories:
| Band | PM2.5 (µg/m³) |
|---|---|
| Low | below 60 |
| Moderate | 60 to below 120 |
| High | 120 to below 250 |
| Very High | 250 and above |
How good is it? An honest look
A forecast is only useful if you know how wrong it can be, so I tested the model on days it had never seen. It was trained only on data before 2025. The tests use January to June 2025 (validation) and July to December 2025 (test).
To judge it fairly, I compared it with two very simple guesses: “just repeat yesterday’s reading” and “use the average of the last three days”.
Test period (July to December 2025) — the table shows the average miss (MAE) in µg/m³. Lower is better.
| Method | Average miss | R² (0 to 1, higher is better) |
|---|---|---|
| SmokeGuard model | 22.24 | 0.697 |
| Repeat yesterday | 23.62 | 0.524 |
| Average of last 3 days | 25.98 | 0.607 |
What this means in plain words:
- On the test period, SmokeGuard has the smallest average miss, about 6% better than repeating yesterday and about 14% better than the 3-day average. That is a modest gain, not a dramatic one.
- R² of 0.697 means the model captures roughly 70% of the ups and downs in PM2.5 over that period.
- On the earlier validation period it was about even with repeating yesterday on average miss (19.21 vs 19.26), with small gains elsewhere. Its R² there was 0.405, much lower than 0.697, so results depend a lot on which months you look at.
- An average miss of about 22 µg/m³ is large compared with a risk band that is only 60 wide. A “Moderate” forecast could really be on the Low or High side.
- The model fits the years it learned from far more closely (R² 0.959) than later months. That is normal for this kind of model, but it means scores on old data should not be read as expected accuracy.
So SmokeGuard is useful but not highly accurate. That is why the dashboard always says its numbers are estimates.

On unseen months, the model beats two simple guesses, but only by a modest margin.
The stack
- Python, pandas and scikit-learn: Data preparation, feature engineering and the Random Forest model.
- NASA FIRMS and Open-Meteo: Satellite-based fire detections and live wind data.
- FastAPI and Uvicorn: Serve predictions, forecasts and AI-generated safety advice through REST API endpoints.
- Amazon SageMaker Serverless Inference: Runs the trained model in the cloud using the
smoke-forecasterendpoint inus-east-1. - Amazon S3 and Amazon ECR: S3 stores model and data files; ECR stores container images.
- Amazon ECS with AWS Fargate: Runs the containerized backend without managing servers.
- Amazon API Gateway and Elastic Load Balancing: Provide HTTPS API access and route requests to the backend.
- AWS IAM and Boto3: Manage permissions and let Python interact securely with AWS services.
- Strands Agents SDK: Connects forecasting, weather and location tools into an AI agent.
- React, Vite, JavaScript and CSS: Power the interactive web dashboard.
- three.js: Renders the interactive 3D NCR pollution heat map.

SmokeGuard architecture.
The dashboard, screen by screen
The dashboard is called Air Outlook. You search for a neighbourhood or monitoring station, and it shows everything about that place on one page.

Search for any monitoring location and check its air
In this example I picked R K Puram, Delhi (DPCC). The dark card shows the forecast date (10 October 2026) and notes that this is a model prediction.
Just below it is a section I care about a lot, Fire source freshness. It lists how old each ingredient is:
- the last PM2.5 measurement (4 days old),
- the weather (observed on 11 Oct 2026 at 3:30 PM, from Open-Meteo),
- the fire detections (2 day old), and
- the moment the fire clues were recalculated (11 Oct 2026, 10:43:12, from 46 satellite detections).
A yellow badge says “Some data is older”, and a note explains that recalculating the clues does not prove the satellite feed itself is current. I wanted the app to say this openly instead of looking more certain than it is.

The prediction, the latest real reading, the wind and the nearby fire
The big dark card shows the predicted PM2.5: 71.5 µg/m³, Moderate risk, and states clearly that it is a prediction, not a measurement. Next to it:
- Latest observed PM2.5: 64.5 µg/m³, measured on 7 Oct 2026, so you can compare the forecast with a real reading.
- Wind speed: 7.2 km/h, blowing from about 122 degrees clockwise from north (roughly from the south-east).
- Downwind fire detections within 50 km: 0.
- Closest downwind fire: 55.6 km away.

A plain-English explanation and a recommended action
The bottom of the page has two cards. What the forecast suggests explains the numbers in one sentence. Your recommended action gives simple advice. For Moderate risk it says: “Take sensible precautions outdoors. Sensitive individuals should consider reducing prolonged outdoor exposure.” A small line reminds you that the advice is based on the risk category and is not a medical assessment.
The 3D map on the landing page
The landing page has an interactive 3D map of Delhi and the districts around it. You can turn it, zoom in, and hover over any area to see its name and PM2.5 value.
- Colour shows the risk: green, yellow, orange and red follow the same four risk bands.
- Height is relative: the area with the highest PM2.5 is the tallest and the lowest is the shortest. Use the colour and the number for the actual level.
- Poles show the stations: each monitoring station is a small pole standing over its area.
- A pin marks the worst spot: it sits on the area with the highest PM2.5 in the whole region.
- Two views: buttons switch between Entire NCR and Delhi.
- Names only on hover: area names appear only when your pointer is on that area, which keeps the map clean.
The first version showed only Delhi. But some of the highest readings were in NCR towns outside Delhi, so I extended the map to all 24 NCR districts outside Delhi as well:
- Haryana (14): Faridabad, Gurugram, Nuh, Rohtak, Sonipat, Rewari, Jhajjar, Panipat, Palwal, Bhiwani, Charkhi Dadri, Mahendragarh, Jind and Karnal.
- Uttar Pradesh (8): Meerut, Ghaziabad, Gautam Buddha Nagar, Bulandshahr, Baghpat, Hapur, Shamli and Muzaffarnagar.
- Rajasthan (2): Alwar and Bharatpur.
Two honest notes about the map:
- It shows measured readings, not the model’s predictions. Each area shows the average of the latest readings from stations inside it. If an area has no station, its value is estimated from nearby stations and labelled that way.
- The smoke clouds, fire glows and haze are only for looks. Their positions are placeholders, not live satellite detections.
What fought back
My first results table did not hold up. I had written down accuracy numbers early on, but when I wrote a script to recompute them, the numbers did not match. I re-ran everything, added checks that the right model and data were loaded, that the test months came after the training months, and that nothing from the future leaked into the inputs, and replaced the table with numbers anyone can reproduce. The new numbers were less flattering. Showing them honestly was still the right call.

The checks that made me trust the results
The first map came up blank. My first attempt used a standard mapping library and showed an empty screen. I switched to a 3D engine (three.js) and rebuilt the map from district shapes. Even then, boundary lines were hard to see, so I redrew them, and the Delhi-only map hid the polluted towns around Delhi until I added the 24 NCR districts. Shapes taken from two different sources do not line up perfectly, so a few stations land in a neighbouring district or in none.
The AI reasoning part is not proven. The project is called an “agentic” forecaster, and I explored using the Strands Agents SDK with a language model on Amazon Bedrock. Because of account and model-access limits I could not verify that part, so the advice you see comes from simple written rules, and I say so.
Fresh calculations are not the same as fresh data. The system can recalculate its fire clues at any moment, but that does not mean the satellite data behind them is current. This is why the freshness panel exists.
The model file is big. The trained model is about 259 MB, too large to keep in the code repository, so it is stored separately and packaged into the cloud container.
Limitations
- It is a same-day estimate, not a forecast several days ahead. It uses that day’s wind, the previous day’s fires and recent PM2.5 readings.
- Accuracy varies by place and by period, and some estimates can be far off.
- Wind in the training data is a historical daily value, while live forecasts use the current wind reading, which is not exactly the same thing.
- The “readings from 1, 3 and 7 days ago” are counted by position in the data, so when days are missing a reading can be older than its name says.
- It was tested on later dates at the same stations. It has not been tested at places with no monitoring station.
- Estimates are for monitoring locations, not for a specific home, school or hospital.
- A forecast needs at least 7 recent readings for the location.
- The dashboard search lists 63 stations found in the latest data file, while forecasts are built for the 56 locations in the project’s location list.
- NCR district shapes come from older (2011-era) boundaries.
- SmokeGuard is a decision-support prototype. It is not a replacement for official air-quality forecasts, health guidance or validated atmospheric models, and its risk bands are not official categories.
Who this is for
- Parents, teachers and school staff who want a clearer picture of the air near a school.
- Hospitals and clinics planning for pollution-heavy days.
- Anyone in Delhi-NCR who wants more than a single city-wide number.
- Students and developers curious about how satellite data, weather and machine learning can be combined, and how to build and test such a project honestly.
You do not need any technical background to use the dashboard: search for a place and read the card.
What I learned
- Compare against simple guesses. A model only looks good when you show what “just repeat yesterday” would have scored.
- Test on the future, not the past. Splitting by date and checking for leaks changed how much I trusted my own results.
- Show your uncertainty. Freshness labels, “this is a prediction” notes and clear limits make a tool more trustworthy.
- Managed cloud services save time. SageMaker Serverless let me deploy a model without running a server.
- A map can be data and storytelling. Making a 3D map from district shapes taught me a lot about projections, hover interactions and keeping visuals honest.
What’s next
- Verify the AI-agent reasoning with a language model on Bedrock, so advice can go beyond fixed rules.
- Drive the map’s smoke visuals from real satellite detections instead of placeholders.
- Test the model at places without monitoring stations.
- Make the wind and “days ago” inputs identical in training and live use.
Try it
- Code: https://github.com/Jeevesh2605/smoke-dispersion
- Live Link: https://main.dy6n1f6aqiebr.amplifyapp.com/
Built for the WeMakeDevs x AWS Environmental Hacks (Track 01: Air).
SmokeGuard is a decision-support prototype. It is not a substitute for official air-quality information or medical advice.
Tags: #python #machine-learning #amazon-sagemaker #strands-agents #fastapi #react #air-quality #climate
Enjoyed reading this content? Let the author know!
Your likes, comments, shares, and saves help creators reach more builders.

Loading recommendations
Loading article