
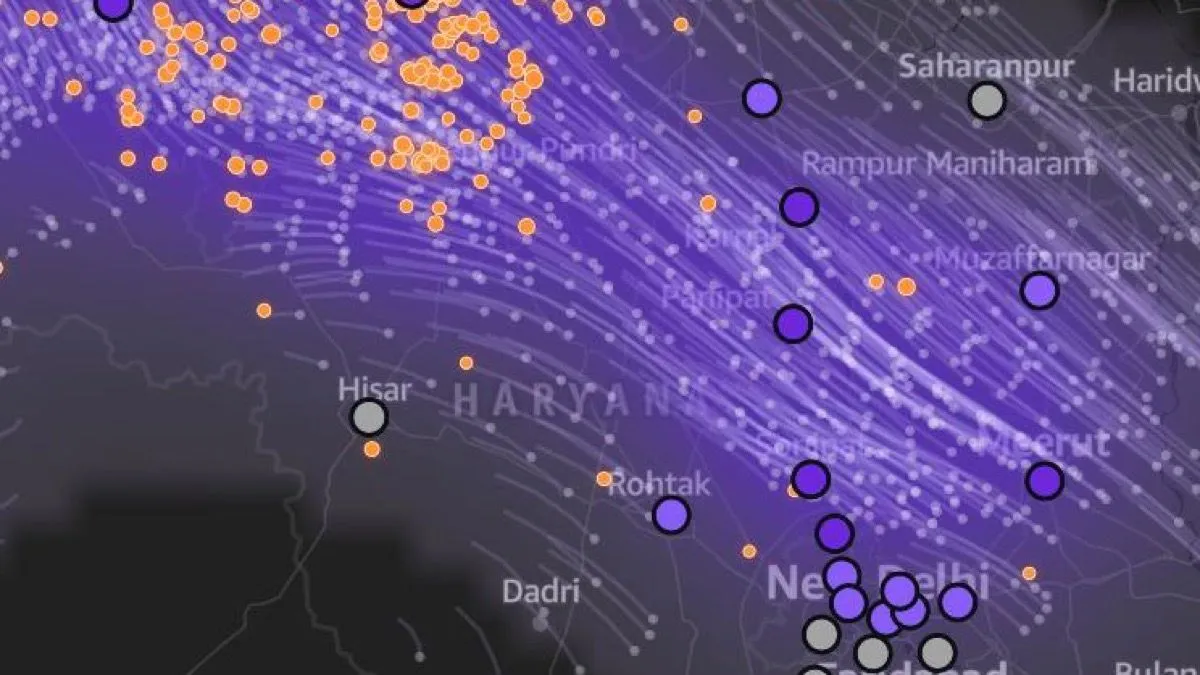
My teammate called our idea dumb. So we built a weather forecast for smoke.
How we turned NASA fire satellites, a wind forecast and a stack of AWS services into smoke alerts for north India, in one weekend.
i am 4th year btech student (aiml)
At 8:20 on Saturday night, with about a day left in the hackathon, I posted our plan in the team WhatsApp group. It was a tidy plan. An AI had written most of it.
A few minutes later one of my teammates replied, in Hinglish and less politely than this: "Honestly, this is a dumb idea. It's basically detecting AQI from a picture. Give it to Gemini, it'll do the same thing. Why even build an app?"
He had a point. That plan was an app that looked at photos of your bedroom and estimated the smoke inside. Before it, we'd already dropped a rooftop-solar calculator for a similar reason: we suspected half the teams had asked an AI the same question and got the same answer. Both ideas were advice, and a chatbot is very good at advice.
So we made one rule for the next idea: it has to do something a chatbot can't. It needs live data and real computation, and it has to keep working when nobody is looking at it.
That rule gave us Dhuaan.
The problem: smoke shows up as a surprise
Every October and November, crop-residue fires burn across Punjab, Haryana and Pakistan's Punjab province. NASA's VIIRS instruments, on three satellites, spot them within hours. On 31 October 2025, one of those satellites alone logged 1,212 fire detections in the region.
For the people downwind, the smoke still arrives without warning. It often comes at night, when the air near the ground stops mixing and holds whatever drifts in. AQI apps report it once you're already breathing it. Nobody tells a parent at 10 PM that smoke from fires near Sangrur will be over Rohini by 3 AM.
Dhuaan (धुआँ, Hindi for "smoke") is a weather forecast for smoke. For any place in the region, it tells you when farm-fire smoke will arrive, when it will be heaviest, when it will clear and which fires it's coming from. If you subscribe, it messages you on Telegram before the smoke gets there, in Hindi or English.
- Replay of a real bad night (press play): https://main.d300fn6sn0z3go.amplifyapp.com/?replay=2025-10-31
- Telegram bot: https://t.me/DhuaanSmokeBot
How a smoke forecast works (the short version)
I'm not an atmospheric scientist, so I kept the model simple enough that I could check every step.
1. Find the fires. NASA FIRMS publishes active-fire detections from VIIRS on Suomi-NPP, NOAA-20 and NOAA-21 as plain CSV files. They're free, and the last 24 hours don't even need a key. We keep a box covering 72.5–78.5°E and 27.5–32.6°N, drop low-confidence points and two known refinery flares, merge the same fire seen by two satellites, and group the rest into clusters of about 11 km. Each cluster carries its total fire radiative power (FRP), a decent proxy for how much smoke it's putting out.
2. Get the wind. Open-Meteo returns an hourly forecast for many points in a single request. We ask for wind at 925 hPa, about 750 m up, which is inside the layer where crop smoke travels, on a 13 × 11 grid. We also ask for the boundary-layer height, which matters in step 4.
3. Follow the smoke. Each cluster releases a "puff" of smoke every hour for six hours. Every puff is pushed through the wind field in 15-minute steps for up to 36 hours with a midpoint (RK2) integrator. If you've heard of NOAA's HYSPLIT model, this is the same idea, stripped down a lot.
Python
# one RK2 step for every puff at once (lat/lon in degrees, dt in seconds)d1lat, d1lon = velocity_deg(grid, lat, lon, t)mid_lat, mid_lon = lat + d1lat * dt / 2, lon + d1lon * dt / 2d2lat, d2lon = velocity_deg(grid, mid_lat, mid_lon, t + dt / 2)lat, lon = lat + d2lat * dt, lon + d2lon * dt
The first unit test in the project checks a classic trap. Wind direction in weather data is the direction the wind blows from. A wind "from 315°" (north-west) carries smoke to the south-east. Get the sign wrong and your smoke flies to Pakistan instead of Delhi.
Python
def dir_to_uv(speed, direction_deg):th = np.radians(direction_deg)return -speed * np.sin(th), -speed * np.cos(th) # from 315° -> u > 0 (east), v < 0 (south)
4. Turn puffs into a number. Each puff spreads as it ages (its width starts at 5 km, grows by 3 km an hour and stops at 80 km) and fades with a 24-hour e-folding time. Adding them up gives a Smoke Index from 0 to 100 for every 0.1° cell and every hour. At night, when the boundary layer is shallow, the index goes up (by at most 3×), because that's when smoke gets trapped. It's scaled so that 1,000 MW of fires 150 km upwind, with a 5 m/s wind, peaks at 80.
The Smoke Index is relative. It is not a PM2.5 reading, and it doesn't include traffic or dust. Every screen and every alert says so, because a tool that hides its limits doesn't deserve trust.
5. Answer real questions. For every town and Delhi zone, the engine reports when smoke crosses "moderate", when it peaks, when it clears, and what share comes from which districts. It also ranks every fire cluster by people-hours under smoke for the next 24 hours. That's the number a district officer can actually act on.
The AWS side
The whole thing runs by itself every three hours.
The full architecture diagram is in the project README: https://github.com/VividhDesign/dhuaan#architecture-on-aws
Amazon EventBridge Scheduler starts the pipeline every three hours. It also sends the daily messages: schools at 6:30 AM, residents at 7:00, officials at 8:00. SAM's
ScheduleV2 event takes a time zone, so I could write IST cron without converting to UTC:YAML
DailySchool:Type: ScheduleV2Properties:ScheduleExpression: cron(30 6 * * ? *)ScheduleExpressionTimezone: Asia/KolkataInput: '{"mode": "daily_school"}'
AWS Step Functions fetches fires and winds in parallel, then runs the model, the bulletin and the alerts. The fetches retry on failure. The bulletin and alerts sit behind a Catch, so a Telegram outage can't break a forecast.
AWS Lambda (Python 3.12 on arm64) runs each step. The numpy model takes about a second per run.
sam build cross-compiled numpy for Linux arm64 on my Mac without Docker, which I didn't expect to just work.Amazon S3 keeps every raw FIRMS file and wind grid (a small data lake, one folder per run) and the published forecast JSON.
Amazon API Gateway (HTTP API) serves the forecast and audio files, place search, email sign-up and the Telegram webhook.
Amazon Polly reads the bulletin aloud in Hindi with the Kajal neural voice. For a lot of people's parents, a voice note beats a chart.
Amazon Location Service draws the dark basemap and turns "Rohini", typed into the bot, into coordinates.
Amazon SNS sends the email alerts. It's one topic, with a subscription filter policy on a
cell attribute, so each person only gets alerts for their own 0.1° square:Python
sns.subscribe(TopicArn=topic, Protocol="email", Endpoint=email,Attributes={"FilterPolicy": json.dumps({"cell": [cell], "lang": [lang]}),"FilterPolicyScope": "MessageAttributes"})
Amazon DynamoDB stores subscribers, AWS Systems Manager Parameter Store holds the bot token and API keys, and AWS Amplify Hosting serves the React app. All of it is defined in one template and deployed with the AWS SAM CLI, with Powertools for AWS Lambda handling routing, logging and metrics.
What fought back
The live data said "no smoke". The first time I ran the forecast on real data, with 607 fires in 235 clusters, every place in Delhi came out at 0 or 1. For a few minutes I was sure the model was broken. It wasn't. Most of that day's fires were across the border in Pakistan's Punjab, and the wind was blowing west. Correct, but useless for a demo. That's how replay mode happened: pick a past date, use only the fires and the wind forecast that existed at that moment, and run the same engine.
CloudFront wouldn't let a new account in. My first
sam deploy rolled back the entire stack with "Your account must be verified before you can add new CloudFront resources." Nothing warned me before the deploy. I made the CDN optional with a template condition and served the data through the HTTP API instead. Turning it back on is one parameter.Bedrock was locked too. I'd planned to use Amazon Bedrock to polish the bulletins. First it said the account was being verified. Later every model returned a bare
Operation not allowed , in two regions. In the end that was fine: I didn't want a language model anywhere near the numbers anyway. The bulletin is built from the run's own figures, and Polly, which did work, reads it out.A circular dependency with sixteen suspects. I gave the bulletin Lambda the API's URL as an environment variable. The API's Lambda already referenced the state machine, and the state machine invoked the bulletin Lambda. CloudFormation found the loop and listed sixteen resources without saying which edge closed it. The fix was to store a relative audio path and read the base URL from Parameter Store at runtime.
sam build failed, and sam deploy shipped the old build anyway. An unquoted {name} path parameter in a YAML flow mapping broke the parse. My script only printed the last couple of lines of the build output, so I missed the error, and deploy happily pushed the previous build. I noticed only because the same CloudFront error came back after I'd made CloudFront optional. Lesson: never tail your build output.The front end had its own fights. deck.gl wouldn't install, because one of its dependencies pointed at a package version that didn't exist on npm. I dropped it and drew the moving smoke trails with plain MapLibre layers. Then MapLibre v6's web worker broke under Vite's bundling, so I pinned v5. Then the map rendered at zero height, because MapLibre's own CSS sets its container to
position: relative , which beat my absolute inset-0 . A wrapper div and a ResizeObserver fixed it.And a small one:
DhuaanAlertBot was already taken on Telegram. We are @DhuaanSmokeBot .Did it actually work?
The fair test is a night we already know about. Replay mode takes the fires known at 8:30 PM on 31 October 2025 (1,209 detections after filtering, 577 of them across the border) and the winds as they were forecast at the time.
Dhuaan's forecast: smoke reaches Narela, on Delhi's northern edge, around 1:30 AM, and Rohini around 3:30. It's heaviest around 6:30 and clears by about 10:30, coming mostly from fires near Sangrur and Mansa. Just 25 clusters account for 62% of the modelled smoke over Delhi.
What happened: Delhi's AQI went from 218 on 31 October to 251 on 1 November, with eight stations in "very poor". The worst was Wazirpur, in north-west Delhi, the side the forecast says the smoke came in from. (CPCB figures, reported by The Daily Guardian: https://thedailyguardian.com/india/delhi-aqi-on-novenmebr-1-2025-delhi-breathes-polluted-air-again-aqi-touches-251-mark-677349/ )
One night is not a validation study. AQI includes traffic, dust and everything else, so it can't confirm the smoke share on its own. But the direction and the timing line up, and those are what a warning needs. A season-long backtest against hourly CPCB data is the next thing I want to do.
What I'm taking away
- Run the chatbot test on every idea. If an AI can hand someone your idea in one answer, it isn't your idea yet.
- Real data is the best debugger. Fetching one live FIRMS file before writing the parser showed that the confidence column says
nominal, notn. And the "no smoke" result taught me more about the problem than any unit test.
- Ship the honest version first. Every screen says the index is relative. No farm or farmer is ever named: clusters take the name of the nearest district HQ, and the ranking is there to send help, not blame.
- Use AI for the typing, not for the idea. I built this with Claude Code as a pair programmer. It wrote most of the code while I made the calls, set up AWS and tested it against real data, and that's the only reason it fit in a weekend. The rule that got us there came from a teammate who called our plan dumb.
What's next
WhatsApp alerts through AWS End User Messaging Social, so nobody needs Telegram. A proper season-long backtest. Fires from Madhya Pradesh and Uttar Pradesh. And a version for district control rooms, where the hotspot list becomes a daily dispatch plan.
If you live downwind of the paddy belt, try it: send your area name to https://t.me/DhuaanSmokeBot and it will tell you whether smoke is coming.
Built by team Jhadu uthao Parth (yes, that's our name) for Environmental Hacks, WeMakeDevs × AWS. Fire data: NASA FIRMS. Weather: Open-Meteo.
Enjoyed reading this content? Let the author know!
Your likes, comments, shares, and saves help creators reach more builders.

Loading recommendations
Loading article