
Paryavaran: Data-Driven Geospatial Dashboard for Urban Greenspace Planning
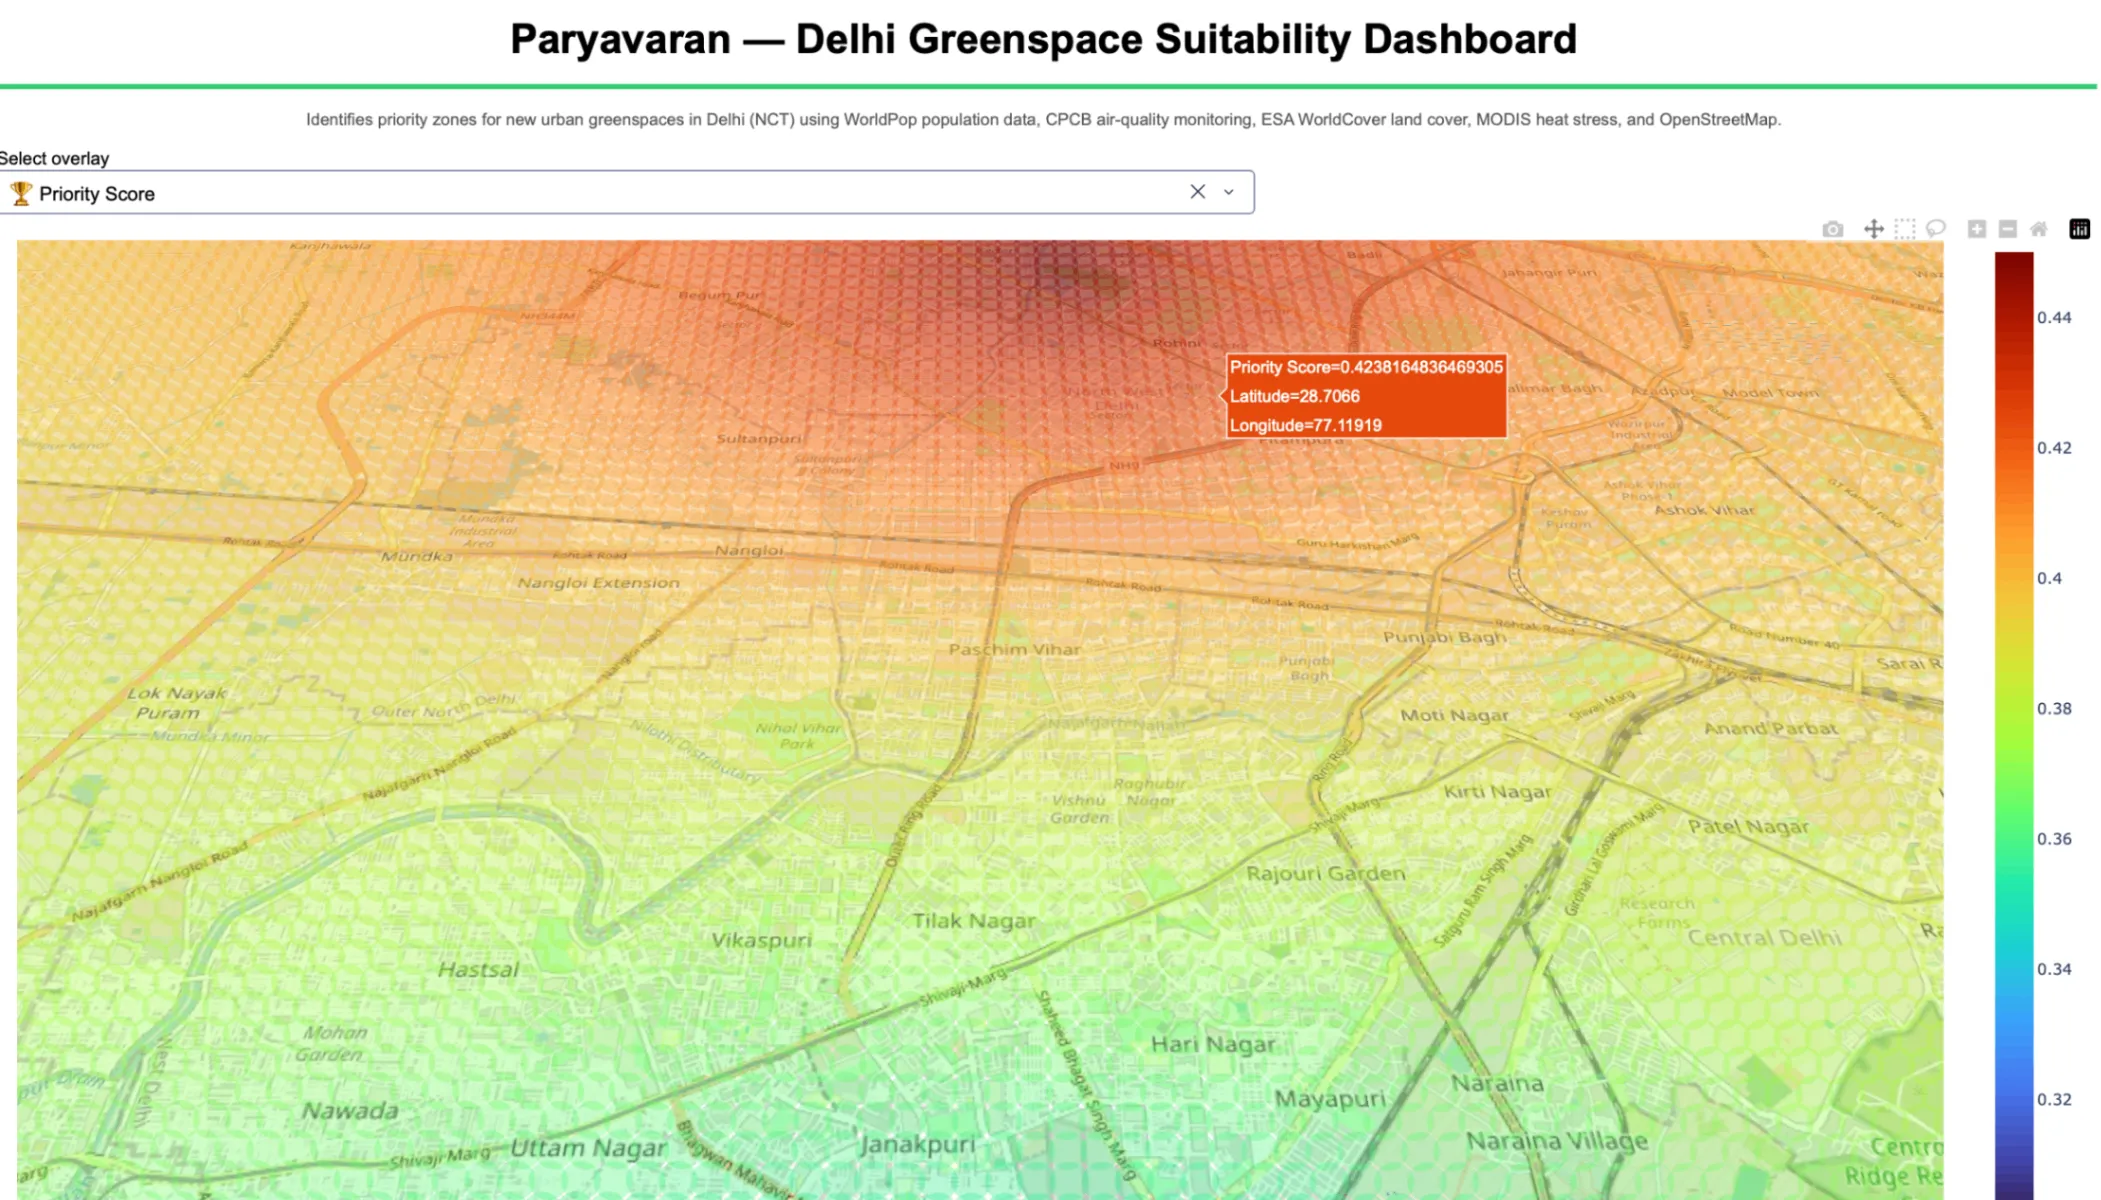
Paryavaran is a data driven geospatial dashboard, which gives a unique "Priority Score" to locations where new green spaces/parks/trees need to be constructed in order to mitigate pollution and urban heat islands in Delhi. Because cities like Delhi are urbanizing at such a rapid rate, they are encountering not only severe pollution problems, but also extreme urban heat islands.


"Today, 56% of the world's population - 4.4 billion inhabitants - live in cities. This trend is expected to continue. By 2050, with the urban population more than doubling its current size, nearly 7 of 10 people in the world will live in cities." - The World Bank
Green spaces improve both the environmental and social conditions of cities. Air quality, population satisfaction, urban temperatures, biodiversity, flood risk reduction, noise abatement - these are among the major benefits of greenspaces in an urban area. We decided to target Delhi (NCT), one of the most densely populated and polluted metropolitan areas in the world, to see how open data can inform the locations for green spaces that would maximize their positive effects on these urban conditions.
We extracted raw data from multiple open sources—ranging from WorldPop demographic estimates to NASA MODIS satellite data and Central Pollution Control Board (CPCB) monitoring stations. We processed them by upsampling to a high enough resolution (250m) that makes the dashboard highly usable by city planners. The resolution itself is a parameter, with distance-weighted k-nearest neighbours (KNN) and vectorized spatial joins enabling high-performance processing across the city grid.
The final dashboard aggregates the underlying data into a Priority Score that summarizes where potential greenspaces would most benefit the urban conditions of Delhi.
Besides obviously expanding the datasets and getting true domain experts to refine the greenspace calculation, we see an expansion of scope of this project to envelope other major cities of the world, like Mumbai or Bangalore. Once this is achieved, further aggregated analysis can be provided on the dashboard such as relative metrics to compare cities.
Our resolution of 250m is a parameter. The vectorized processing pipeline facilitates any resolution, however, ideally, one would prefer to add higher resolution data to begin with so that predictions do not deviate from reality.
We have demonstrated our dashboard via Plotly Dash, which suited our needs for a Minimum Viable Product, but given more time, we would implement our dashboard in a more scalable cloud infrastructure environment to handle global datasets without bottlenecking.
Enjoyed reading this content? Let the author know!
Your likes, comments, shares, and saves help creators reach more builders.

Loading recommendations
Loading article