
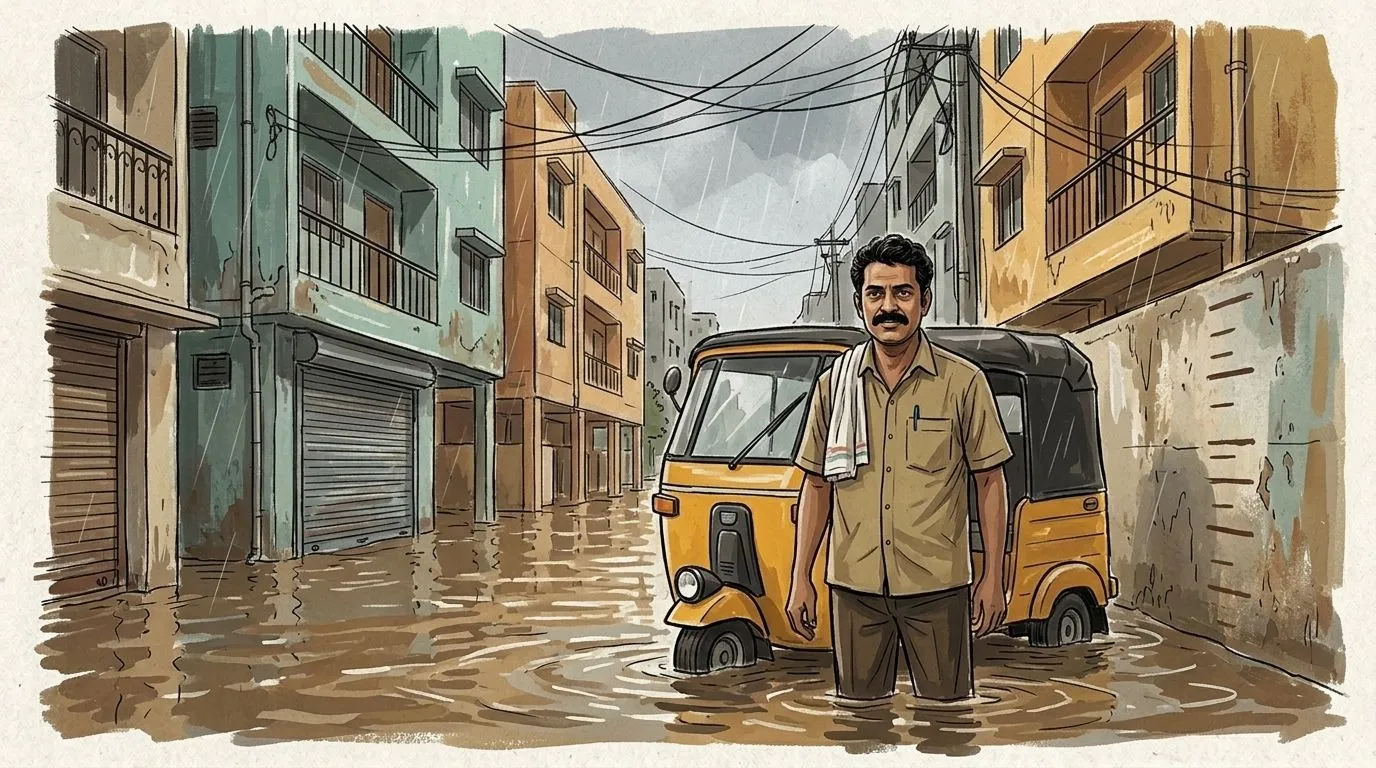
A place can look perfect. Until it rains.
Chennai flood history for 202 areas, from ten years of news. A free tool I built with Amazon Bedrock, DynamoDB and Amplify to check before you rent or buy.

I fainted from the heat in Chennai once.
Nobody had told me how hot it actually gets. Not on the weather app, not from anyone around me.

Later I realised it's not just heat. Nobody tells you anything about an area before you move in.
The broker won't say the street floods. The listing says "24 hrs water, very safe area." The landlord says "no problem here."
Then the monsoon comes.

This is what I built for Environmental Hacks (WeMakeDevs × AWS), Heat and Water track.
The problem I picked
I'm a digital marketing student, not a developer. I picked one small problem inside the Heat and Water track:
people in Chennai choose where to live without knowing if that area floods or how hot it gets.
The information exists. It's just scattered.
- Every monsoon the news reports which areas went under water.
- After Cyclone Michaung in December 2023, water stood for about a week in parts of Pallikaranai, Thoraipakkam and Kodungaiyur.
- Residents remember all of it.
- Someone signing a lease next month has no way to find it.
So the question became simple. Can I put ten years of that news in one place, area by area, and show it before someone pays the advance?
What I built
Chennai Unsaid. Live here: https://main.d1v8v4f0epo1xy.amplifyapp.com

Pick an area, see how high the water came. Take it: the live site’s home page, water mode.
- Flood history for 202 Chennai areas. Pick an area, tap a year, and the water on the wall rises to how high it came that year. Every mark has the news article behind it.
- Heat. Live temperature, how hot it felt on the worst day of the past year, and what that means for a normal day.
- Check a property. You paste the broker's message. It reads the area, floor and parking, checks what they claimed against the record, and gives you the questions to ask.
- Compare two flats. Flooding, heat and water side by side, with the source and date on every line.
- Will your water last? If a supply cut is announced, it works out how many days your stored water lasts.

Tap a year. The water goes to the level the news reported, with the article right below.

The broker said no flooding. The news said five flood years.
That last screenshot is the whole idea in one picture.
The app never says "don't live here." It shows what happened, where it came from, and what to ask.
Why there's an auto driver
Flood data in a table is boring. Nobody reads it.
So the guide is a Chennai auto driver standing next to his auto.
- Ankle deep, he has an umbrella.
- Knee deep, he's worried.
- Water inside homes, arms crossed.
- In the heat, he's wiping his face, and if you tap him he drinks water and tells you what to do.

Heat mode. Tap him and he tells you what to do about it.
He's there to make you read the evidence, not to replace it.
How AWS does the actual work
Here's the thing. The hard part was not the website. It was turning 190 messy news articles into data I could trust.

Amazon Bedrock (Nova Lite) read every article and pulled out records like: which area, which date, how bad, how many days the water stayed, and the line from the article that says so.
Then I made it check its own work. A second pass re-read each article and asked one question: does this article actually say this area flooded?
Amazon DynamoDB stores everything: the flood records, heat ratings for 202 areas, residents' reports, and the summaries so they don't get regenerated on every visit.
AWS Amplify Hosting runs the site. It deploys from GitHub every time I push. The site talks to DynamoDB and Bedrock through an IAM role, so there are no passwords or keys anywhere in the code.
What went wrong
A lot. These are the ones that taught me something.

1. The app said Velachery flooded in 2026. It didn't.
The record came from a 2026 election article where residents talked about the 2015 floods. The AI took the article's date as the flood date.
I only caught it because I clicked on 2026 and thought, wait, there was no flood this year.
So I added two checks:
- if a record talks about an earlier year, it's a look-back, not a new flood
- if the article is an opinion piece or a report card and not a flood report, its undated records are dropped
81 of the 190 articles turned out to be feature pieces. After cleaning, 304 records across 82 areas stayed. Fewer, but I trust them.
2. Counting news articles is not a fair comparison.
An area that gets written about more looks worse. So for comparing two flats I added measured numbers, same for every area, same years: the heaviest one-day rain in each monsoon, rain during Cyclone Michaung, and how many days in the past year felt hotter than 40°C.
3. My first auto driver was a stick figure.
It looked bad. Then the background remover I wrote ate holes in his khaki shirt because the shirt was almost the same yellow as the background. I had to change how it detects the background.
4. Small honest gaps I left in.
- It works at area level, not street level. One street can flood and the next one doesn't.
- The rain data is on a 10 km grid, so neighbouring areas can show the same numbers.
- There's no official water supply data connected yet. The app says so instead of guessing.
What I learned
- Data you can't trace back to a source is useless for a decision like this. Every number in the app shows where it came from.
- AI is good at reading. It is not good at being sure. The second check mattered more than the first.
- A small problem done properly is more useful than a big one done vaguely.
What's next
- Connect official rain gauge and groundwater data.
- Street level reports from residents during the monsoon, so "Now" fills itself.
- The same method works for any Indian city that floods. Which is most of them.
So no, a nice listing is not the full picture. The water marks are.
I'm Tanishka, a digital marketing student in Chennai. I'm not a developer. I built this in four days with Claude Code.
Watch the 3-minute demo: https://youtu.be/NSe1TDtaW0Y
Code: https://github.com/tanishkabhatera-bit/chennai-unsaid . Weather data by Open-Meteo (CC BY 4.0). Flood records from DT Next, Deccan Herald and Citizen Matters, linked in the app.
Enjoyed reading this content? Let the author know!
Your likes, comments, shares, and saves help creators reach more builders.

Loading recommendations
Loading article