
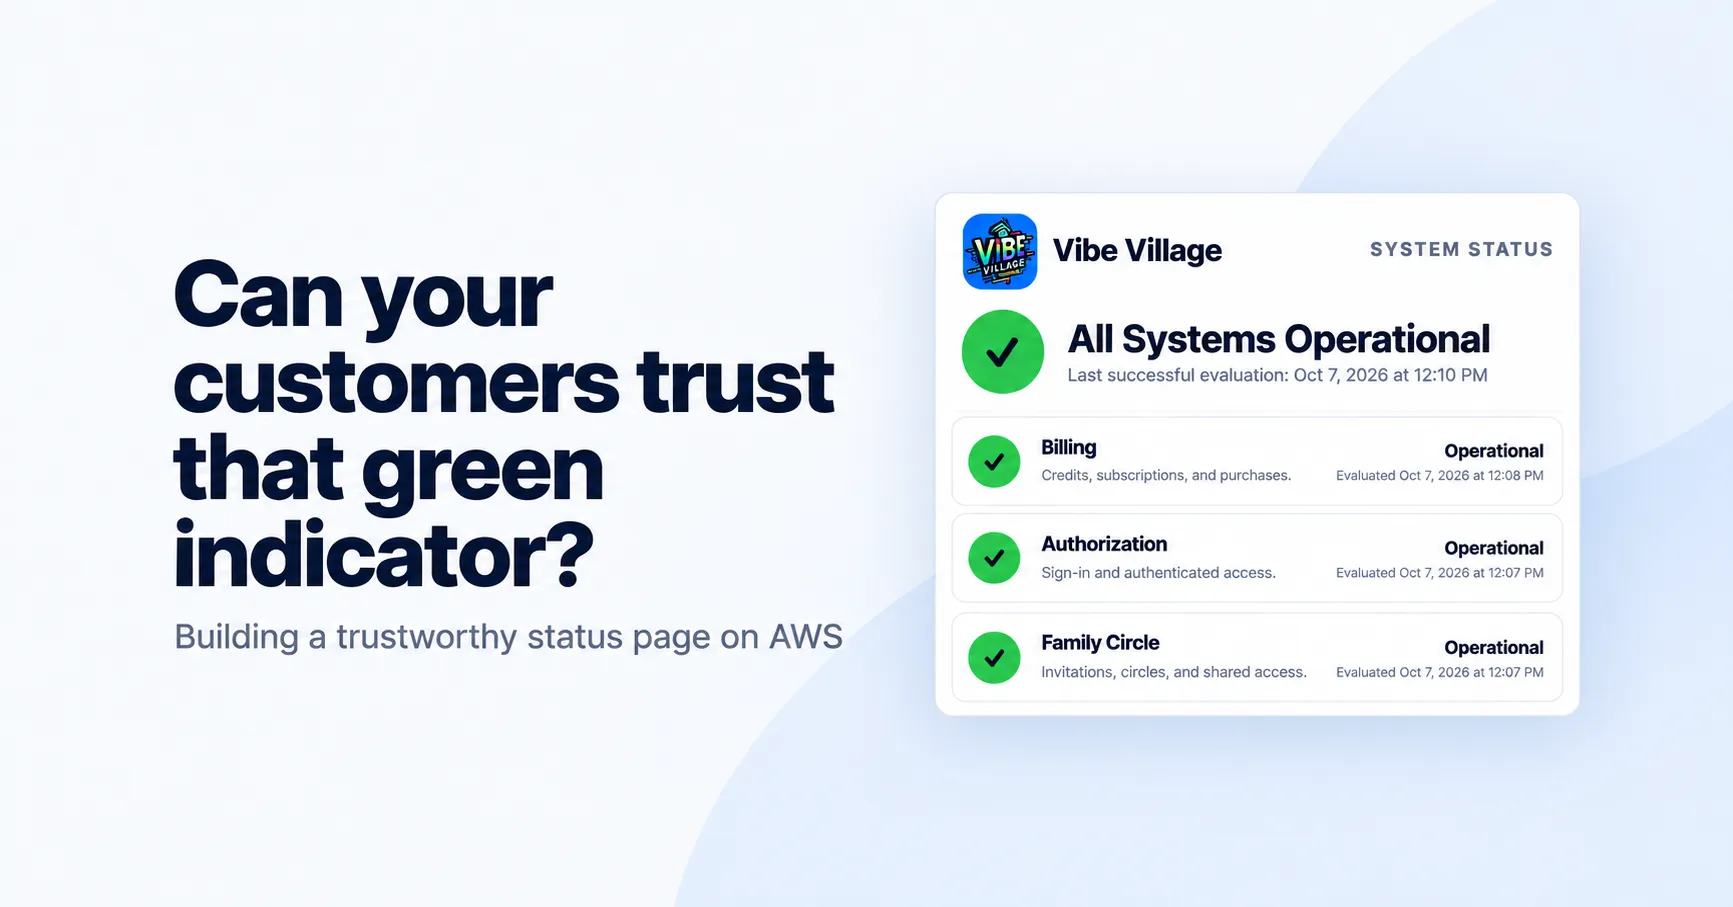
Building a Trustworthy Status Page on AWS: Lessons from Vibe Village
How we built Vibe Village’s public status page using AWS Lambda, DynamoDB, S3, and CloudFront, with practical approaches to freshness, incident communication, regional health, and recorded history.

When an app stops working, customers want to know whether the problem is theirs or the service's. A status page gives them a shared place to check. Technology companies use these pages to communicate the health of their products and services, identify affected features, announce planned maintenance, and provide incident updates through resolution.
A useful status page reduces uncertainty. It helps customers decide whether to wait, try a workaround, or contact support, while giving support teams a consistent source of information. Clear, timely updates can reduce duplicate inquiries and build trust by acknowledging problems and showing progress toward recovery.
But what does a green status indicator actually tell your customers? While building Vibe Village, a social music application, I had to confront that question. A function can be reachable while a customer journey fails. A page can load while its information is hours old. “Operational” needs evidence behind it.
For Vibe Village, we built a separate public status infrastructure on AWS. Scheduled observations feed a Lambda evaluator, which publishes a small JSON document for a static website. We organize that document around customer-facing capabilities: Billing, Authorization, Family Circle, Battles, and Listening Sessions.
The approach rests on a few practical decisions: serve the page independently of the application API, preserve the identity and age of each observation, define explicit state transitions, and keep public communication separate from internal diagnostics. Here is how we put those decisions into practice.
Give the status page its own serving path
When an application API fails, customers should still be able to read an incident notice. Our public page uses a dedicated Amazon S3 bucket and Amazon CloudFront distribution. Reading it requires neither an application login nor a live application API call.
The bucket blocks public access. CloudFront uses Origin Access Control (OAC), with a bucket policy allowing reads through the designated distribution. This requires an S3 bucket origin; S3 website endpoints cannot use OAC.[1] Amazon Route 53 provides DNS, and AWS Certificate Manager supplies the viewer certificate in us-east-1, as CloudFront requires for ACM certificates.[2]
This separation removes application runtime dependencies from the public read path. AWS, account, regional, and DNS dependencies remain shared. Additional account or provider separation requires its own design and verification.
Separate observation, evaluation, and publication
A health check needs access to infrastructure that a public browser should never have. Putting the entire process behind a browser request would also make page availability depend on every evidence source answering in time. We separate collection from evaluation, and publish the result ahead of the customer's visit. Each part has a clear job:
| Responsibility | AWS implementation | Purpose |
|---|---|---|
| Collect | Amazon EventBridge scheduled rules invoke regional AWS Lambda health checks | Record observations and their identity in Amazon DynamoDB |
| Evaluate | A separate EventBridge scheduled rule invokes the public status Lambda every minute | Apply freshness, regional aggregation, and transition policy |
| Retain | DynamoDB tables | Store automatic state, overrides, incidents, maintenance, audit records, and history |
| Publish | Evaluator writes validated status.json to S3 | Expose a limited public view |
| Deliver | CloudFront with OAC and a private S3 origin | Serve website assets and the status document |

Regional observations feed the evaluator; customers read through CloudFront. Static releases manage website assets, while the evaluator owns live status and maintains daily history summaries.
The browser receives public service names, states, timestamps, and reviewed incident wording. Resource identifiers and internal diagnostics stay in the operational system.
Adapt the design to your application
The easiest way to adapt this architecture is to follow one capability from its check to the public browser before expanding it. Consider a small application with Sign-in and Checkout in two serving regions. Sign-in might use a dedicated test account to obtain a token and access a protected resource. Checkout might create and cancel a test order without charging a real customer. Each check needs isolated fixtures and cleanup, as well as a definition of success.
Before provisioning, have an AWS deployment identity, the AWS CLI and a supported Node.js runtime, a domain you can configure, and an owned notification destination. A custom CloudFront domain also needs an ACM certificate in us-east-1. The application-specific work is the check itself: the status infrastructure cannot infer a successful customer journey from a Lambda name.
A configuration file makes those decisions visible. The following example describes an adaptation, rather than Vibe Village's exact configuration format:
1
2
3
4
5
6
7
8
9
10
11
12
13
{
  "components": [
    { "id": "signIn", "name": "Sign-in", "requiredChecks": ["authenticatedAccess"] },
    { "id": "checkout", "name": "Checkout", "requiredChecks": ["testOrder"] }
  ],
  "servingRegions": ["us-east-1", "us-west-2"],
  "checkIntervalSeconds": 900,
  "observationMaxAgeSeconds": 1200,
  "evaluationIntervalSeconds": 60,
  "degradedSets": 3,
  "recoverySets": 5,
  "publicationMaxAgeSeconds": 300
}
The component IDs become stable keys throughout collection, evaluation, history, and rendering. Display names can change without changing those identities. Required checks define a complete regional observation set; adding a region or check changes that denominator and should be treated as a policy change.
Building in this order gives each stage an observable result:
| Stage | Implement | Confirm before moving on |
|---|---|---|
| 1. Public delivery | Private S3 bucket, CloudFront OAC, bucket policy, DNS, and certificate | The public page loads; direct unauthenticated S3 access is denied |
| 2. Evidence | One scheduled regional check and observation storage | A real execution writes an identity, event time, and meaningful result |
| 3. Evaluation | Freshness, aggregation, transitions, state persistence, and public projection | Fixture observations produce the expected public states |
| 4. Publication | Evaluator S3 write and publication metric | The public JSON timestamp advances through CloudFront |
| 5. Browser | Validated rendering, refresh, independent aging, and history | Failed requests cannot keep an old green result current |
| 6. Operations | Manual controls, atomic audit, summaries, and SNS routing | Controlled updates are attributable; a test alert reaches its intended destination |
An infrastructure-as-code template for this design should expose parameters for resource names, component and region configuration, intervals, history retention, and the SNS destination. Its permissions follow the same boundaries: collectors write observations; the evaluator reads evidence, updates automatic state and history, and writes the public document; administrators mutate approved manual records and audit entries. CloudFront receives read access through the distribution-scoped bucket policy.
Define the contract for each check
A successful API response is tempting to translate straight into a green indicator. The difficulty is that different checks succeed for different reasons. A permission check may pass without executing application code; an endpoint may correctly reject a request without proving that login works. Defining the capability, success criteria, timestamp, and observation identity gives the evaluator a contract it can interpret consistently.
| Evidence | What success establishes | What success does not establish |
|---|---|---|
| Lambda Invoke DryRun | Invocation parameters and caller permissions are accepted | Handler execution, dependencies, and transaction success |
| Expected Authorization denial | The tested endpoint returned the specified denial | Successful login or authenticated access |
| Independently scheduled synthetic journey | The implemented journey completed under its test conditions | Untested devices, accounts, regions, and variations |
| Customer outcome telemetry with a defined denominator | Results for observed eligible transactions | Missing or unobserved activity |
For example, our Listening Sessions infrastructure check uses Lambda DryRun to validate parameters and invocation permissions.[3] We treat that result as invocation-permission evidence. Establishing whether a participant can join and hear synchronized music requires an executed journey with its own success criteria.
The customer's question is usually more concrete: “Can I do what I came here to do?” An independently scheduled synthetic journey can answer that question for a defined test case, using dedicated fixtures and recorded outcomes. Measuring an SLO goes further, requiring eligible customer transactions, success criteria, and a policy for missing telemetry. Infrastructure checks and transaction measurements therefore contribute different kinds of evidence.
Connect the stages with explicit data contracts
A check result should be interpretable without rereading the check's logs. Here is an illustrative private observation for Checkout:
1
2
3
4
5
6
7
8
9
10
{
  "component": "checkout",
  "region": "us-east-1",
  "category": "testOrder",
  "runId": "checkout-east-2026-10-07T14:00:00Z",
  "observedAt": "2026-10-07T14:00:00Z",
  "state": "operational",
  "checkVersion": "1",
  "coverage": "create-and-cancel-test-order"
}
The collector generates a new run identity for a new execution and retains it on retries of that execution. Observation time means when the check ran, rather than when an evaluator read it. Failed execution and missing evidence are different outcomes: the collector records a failure when it can, while the evaluator independently detects an absent or aging result.
DynamoDB keys should support the reads the evaluator needs. One possible layout is shown below; these are suggested contracts for the worked example, not a description of every deployed Vibe Village key.
| Records | Example key design | Read or write pattern |
|---|---|---|
| Observations | Partition: component plus region; sort: category plus observation time and run identity | Retrieve the latest observation for each required category; fence delayed writes if maintaining a latest pointer |
| Automatic state | Partition: component | Read counters and accepted identities; update automatic attributes only |
| Manual controls | Partition: component; sort: control type plus ID | Read applicable overrides, incidents, and maintenance with explicit validity windows |
| Audit | Partition: administrative action ID | Write alongside its mutation in the same transaction |
| History | Partition: component; sort: timestamp for raw records or daily#YYYY-MM-DD for summaries | Query a bounded UTC window, consuming pagination |
The public document is a separate contract. An abridged example might look like this:
1
2
3
4
5
6
7
8
9
10
11
12
13
14
15
{
  "schemaVersion": 1,
  "generatedAt": "2026-10-07T14:01:00Z",
  "lastSuccessfulEvaluationAt": "2026-10-07T14:01:00Z",
  "overallStatus": "operational",
  "components": [
    { "id": "signIn", "name": "Sign-in", "status": "operational" },
    { "id": "checkout", "name": "Checkout", "status": "operational" }
  ],
  "incidents": [],
  "maintenance": [],
  "resolvedIncidents": [],
  "recentHistory": [],
  "historyStatus": "partial"
}
The browser and evaluator must agree on field names and schema validation. Internal observation IDs, resource identifiers, and diagnostics are excluded from that projection. A valid current publication can coexist with partial history; those fields answer different questions.
Keep the clocks separate
A newly generated document can contain an old observation. We distinguish observation time, evaluation time, and publication age.
| Clock | Example setting |
|---|---|
| Scheduled health checks | Every 15 minutes |
| Observation freshness window | 20 minutes |
| Evaluator | Every minute |
| status.json cache policy | max-age=60, must-revalidate |
| Browser refresh while visible | Every 60 seconds |
| Publication-staleness threshold | Five minutes |
| Browser request timeout | 10 seconds |
These example values reflect Vibe Village's workload. A freshness window shorter than the check interval would routinely declare evidence stale between healthy runs. A much longer window could conceal a stopped check. Choosing the interval and window together leaves room for execution and delivery delay while bounding how long old evidence remains useful.
An open browser tab introduces another clock. Someone may leave the page visible throughout an incident, so freshness cannot be assessed only when it loads. Our browser reassesses age independently of fetching: failed refreshes leave the original timestamp intact, and an aging publication becomes Unknown. Visibility changes trigger reassessment and refresh, while request fencing prevents older responses from replacing newer data.
CloudWatch timestamps need separate interpretation. StateUpdatedTimestamp describes updates to alarm state metadata, not underlying measurement freshness.[4] The evaluator does not manufacture healthy evidence from successful alarm retrieval. Stable OK without explicit telemetry freshness becomes Unknown; a reported ALARM remains a conservative partial-outage signal. Missing alarms, retrieval failures, insufficient data, and evaluation errors produce Unknown.
Count observations, not evaluator runs
Our evaluator can run fifteen times between checks. Reading one failed observation fifteen times does not create fifteen measurements.
The evaluator identifies observations by run and category. Recovery advances only when every configured serving region supplies a newer qualifying observation. Repeated and older evidence cannot advance recovery.
| Automatic evidence or transition | Vibe Village example policy |
|---|---|
| Stale or unusable evidence | Immediate Unknown; recovery resets |
| Fresh major or partial outage | Immediate outage state |
| Major to partial/degraded, or partial to degraded | Immediate only with newer qualifying evidence |
| Ordinary degradation | Three distinct qualifying sets |
| Recovery to Operational | Five distinct fresh, complete sets |
Recovery is a tradeoff: one healthy result may be a brief improvement, while an overly cautious policy can leave customers waiting after service has recovered. In this example, three sets at a 15-minute cadence span about 30 minutes from the first set; five span about 60 minutes. Collection alignment and delivery delay add time. That makes the threshold a customer-communication decision as well as an engineering setting.
A regional failure adds another question: how much of the service is affected? Counting only the regions that answered can hide gaps in the evidence. Regional aggregation therefore keeps the configured denominator visible. All configured regions must have fresh outage evidence for an aggregate major outage. A known outage mixed with operational or unknown regions yields partial outage. Operational evidence mixed with missing evidence yields degraded performance; all unknown regions yield Unknown.
An operator may declare an incident while probes still report success, or announce maintenance while checks continue running. When that notice ends, the page needs an automatic state it can return to. We preserve automatic evidence and counters independently, then apply the precedence for overrides, incidents, and maintenance to the display. Testing those controls against stale and outage evidence helps ensure the return to automation is predictable.
A small orchestration function connects these rules. The following pseudocode shows the sequence; the named helpers represent application code that needs implementation and tests:
1
2
3
4
5
6
7
8
9
10
11
12
13
14
15
16
now = current UTC time
for each configured component:
    observations = read required checks for every configured region
    regionalEvidence = validate timestamps, identities, and check results
    candidate = aggregate using the full configured region denominator
    previous = read automatic state and accepted observation identities
    automatic = transition(previous, candidate, regionalEvidence, now)
    persist only automatic attributes, with concurrency protection
    controls = read applicable manual declarations
    displayed = apply explicit precedence and expiration to automatic state
    record displayed state and update its UTC daily summary

publicDocument = project only approved public fields
validate publicDocument
write status.json to S3 with its cache and content-type metadata
emit PublicationFresh after the write succeeds
For Checkout, a fresh outage in one of two regions becomes partial outage. If both regions supply fresh outage evidence, it becomes major outage. Once healthy observations return, a repeated evaluator invocation does not advance recovery. Five new complete regional sets are required by this example's policy. The same fixtures can test the implementation before connecting it to live checks.
Give operators an accountable incident path
A customer report can reveal a problem before a probe does. Operators need an authenticated way to acknowledge it, describe the impact, and publish updates without waiting for automation to agree.
The evaluator and operator can both touch the same component within seconds. Replacing the entire state item risks discarding an override the operator just created. DynamoDB UpdateItem lets the evaluator modify only its own attributes, preserving manual metadata. The stored expiration timestamp gives temporary overrides a defined end, even if no operator returns to remove them.
An incident update also creates an accountability question: who changed what, and when? Writing the change first and its audit entry later leaves a gap if the second write fails. Our administration path requires audit configuration and places both writes in one DynamoDB TransactWriteItems request. AWS STS supplies the authenticated actor; the record includes the action, target, and time. Permissions are scoped to the affected tables.
The words useful to an engineer are not always suitable for customers. Internal notes may contain resource names or sensitive details. Explicit fields such as publicTitle, publicImpact, publicMessage, and publicDescription create a deliberate publication boundary. Shared validation applies at administration and publication, and generic wording replaces unsafe text without suppressing a valid incident. DOM textContent lets the browser display the message as plain text.
This is defense in depth. Validation cannot guarantee that free text contains no secrets or identifying information. Operators must review wording before publication.
Make history meaningful and affordable
After an incident, customers may want to see whether a problem was isolated or recurring. A history window provides that context. Vibe Village uses 30 UTC days of recorded public states, with a window other applications can size to their communication needs. These records describe what the page reported; measuring uptime or customer availability requires a separate model.
Each summary retains the worst recorded state and every distinct state observed that day, including Unknown and maintenance. Missing days are Unknown. The browser labels the current UTC day “In progress” and earlier days with explicit summary gaps “Partial history.” Dates are displayed newest first using UTC calendar labels. Manual declarations appear as the public state recorded at evaluation time. Discrete records do not establish continuous coverage between them.
The same records useful for investigation can become expensive to reread every minute. We retain them, but the evaluator also maintains daily summaries incrementally. Publication queries those summaries. Conditional updates and stored record identities protect the aggregation from conflicting writes and duplicate counting.
For example, five components recorded once per minute produce approximately 216,000 raw records over 30 days. One summary per component per day reduces the same window to roughly 150 summary items. The difference makes the history window and retention policy meaningful cost choices, while missing or partial summaries still need to remain visible.
A newly launched page has no past to report. Recording raw states and updating summaries from the first evaluation lets the display grow naturally toward its configured window. Missing periods remain identified. Whether a day is still in progress is determined from the current UTC date, so a stored flag cannot leave yesterday marked as unfinished.
Monitor publication and protect it during release
A working evaluator matters only if customers receive a current document. The evaluator emits PublicationFresh after successful publication. Its freshness alarm uses five one-minute periods with missing data treated as breaching.
An alarm can enter a breaching state without anyone receiving a message. Connecting it to an owned notification destination closes the configuration gap. Our template accepts an Amazon SNS destination for evaluator errors and stale publication, and requires it for production releases. Subscriptions and delivery policies complete the route; an end-to-end exercise confirms that a recipient actually receives the alert.
A website release can accidentally replace the current incident document with a sample file. Assigning ownership prevents that collision: the evaluator owns live status.json, and the static release script excludes it from upload, deletion, and static invalidation. The evaluator creates the first live document. HTML and other unversioned assets require revalidation. Content-versioned JavaScript can use one-year immutable caching, but the versioned renderer must also import versioned modules. For example, index.html can reference
status-<hash>.js, which imports statusState-<hash>.mjs. Changing a dependency changes its filename and the importing renderer's content hash; changing the renderer then changes the HTML reference. This gives each release an explicit asset graph. Releases replace metadata and invalidate the root and published asset paths, including JavaScript modules.A successful S3 upload is only one step toward what a customer sees. CloudFront may still serve cached assets, and a browser may retain an older module. Checking through the public endpoint connects the release to the customer experience: asset hashes should match the manifest, cache headers should match the policy, and publication timestamps should keep advancing after invalidations complete. Controlled browser responses then exercise refresh and stale-aging behavior.
The deployment sequence follows those dependencies. Provision the tables, roles, bucket, distribution, schedules, and alarms through the infrastructure template. Package every evaluator module imported by its handler, configure resource references and policies, and publish the first live document. Build versioned browser assets from their final contents, upload dependencies before the renderer and HTML, then invalidate the HTML entry points. The static release never uploads a sample status.json. DNS and TLS validation complete the custom-domain path.
A short set of expected outcomes makes that first release reviewable:
| Controlled input or action | Expected result |
|---|---|
| Stop refreshing a saved healthy document | The open browser changes to Unknown after the publication threshold |
| Supply stale observations but run evaluation again | Fresh publication does not turn stale evidence healthy |
| Repeat the same healthy regional runs | Recovery counters do not advance |
| Supply an outage in one region and missing evidence in the other | Partial outage, rather than major outage or Operational |
| Create an override, then evaluate | Automatic attributes update while override metadata remains |
| Force an administration transaction failure | Neither the mutation nor its audit entry commits |
| Release new browser assets | Public HTML and every imported module resolve to the intended version |
| Request historical dates without records | Missing evidence remains visible; no healthy days are fabricated |
These checks can begin with deterministic fixtures. AWS permission, transaction, notification, and browser-delivery checks then verify the boundaries that fixtures cannot establish.
Validate the implementation and estimate its cost
A small static page can sit in front of a surprisingly busy evaluation pipeline. A one-minute schedule alone produces 43,200 evaluator invocations in a 30-day month. A useful estimate follows the full path: check execution, DynamoDB item sizes and operations, retained data, logs, monitoring, and public traffic. Actual usage provides the basis for a defensible monthly price.
The healthy path shows the parts can work together. Customers rely on the page when some of those parts stop working. A verification plan therefore needs publication failures, missing regional observations, outages, recovery, concurrent overrides, and failed administration transactions in a controlled environment. The useful evidence is the resulting public document, browser behavior, and delivered alert.
Those exercises answer defined operational questions. Disaster recovery and availability measurement each need their own evidence. Recovery exercises establish how the system behaves during defined failures; transaction telemetry with a valid denominator supports availability measurement. Neither follows automatically from a separate serving path.
The goal of a status page is to help customers understand what is happening, which capabilities are affected, and where to find updates. That requires a communication path that remains useful when the application has a problem, with information whose meaning and age are clear.
For Vibe Village, we connected regional observations to a scheduled evaluator, retained state and recorded history in DynamoDB, and published a limited public document through private S3 and CloudFront. Freshness checks keep aging information visible, explicit transition rules govern recovery, and authenticated, audited updates let operators add context. Keeping static releases separate from live publication protects that communication path as the system evolves.
Together, these choices give other builders a practical foundation to adapt to their own applications. The service names, check intervals, and thresholds will vary. The purpose remains the same: give customers a clear, timely account of service health that is grounded in the evidence available.
Explore Vibe Village and its public status page .
AWS references
Enjoyed reading this content? Let the author know!
Your likes, comments, shares, and saves help creators reach more builders.

Loading recommendations
Loading article