
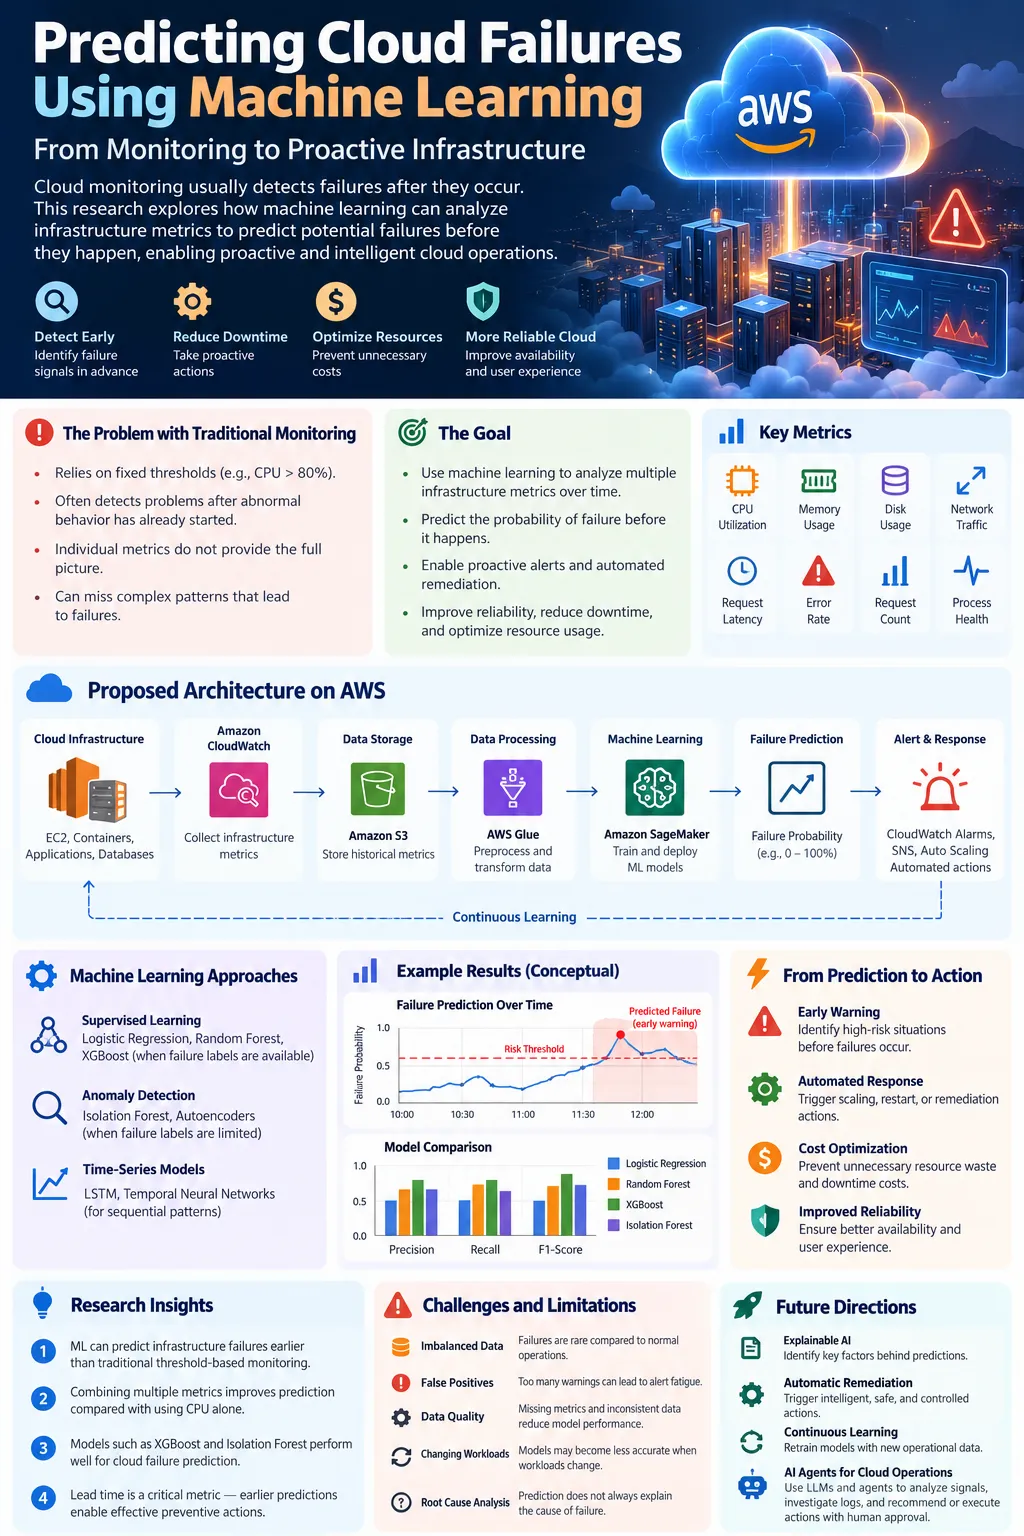
Predicting Cloud Failures Using Machine Learning: From Monitoring to Proactive Infrastructure
Cloud monitoring usually detects failures after they occur. This article explores how machine learning can analyze CPU, memory, network, latency, and system-error patterns to predict potential infrastructure failures before they happen, enabling proactive cloud operations.

Predicting Cloud Failures Using Machine Learning: From Monitoring to Proactive Infrastructure
Modern cloud applications generate large volumes of operational data, including CPU utilization, memory consumption, network traffic, disk activity, response time, request rates, and application errors. Traditional monitoring systems mainly respond to predefined thresholds. For example, an alert may be triggered when CPU utilization exceeds 80% or when error rates cross a specific limit. While this approach is useful, it is reactive: the system often reports a problem after abnormal behavior has already started.
Machine learning provides an opportunity to move from reactive monitoring toward predictive infrastructure management. Instead of asking only, “Is the system failing now?”, a predictive monitoring system attempts to answer, “Is the system showing patterns that indicate it may fail soon?” By learning from historical infrastructure metrics and failure events, machine learning models can identify combinations of signals that are difficult to detect using simple threshold-based rules.
The Problem with Traditional Cloud Monitoring
A typical monitoring system uses fixed thresholds to identify abnormal behavior. Consider a web server where CPU utilization reaches 85%. An alert is generated because the configured threshold is 80%. However, high CPU usage does not always indicate an imminent failure. The workload may temporarily increase and return to normal within a few minutes.
The opposite problem can also occur. A server operating at 65% CPU utilization may appear healthy, but if memory usage is continuously increasing, network latency is rising, and application errors are appearing simultaneously, the system could be approaching failure.
This creates an important limitation: individual metrics do not always provide enough information. Failure prediction requires analyzing relationships between multiple metrics over time.
From Monitoring to Prediction
The proposed approach treats cloud infrastructure as a time-series data source. Metrics are collected continuously and transformed into features that represent the current health and recent behavior of the system.
For example, a feature set could contain CPU utilization, memory utilization, network input and output, disk usage, request latency, error rate, request count, and the rate of change of these metrics.
The machine learning model can then learn patterns associated with two outcomes:
Normal operation — the infrastructure is operating within an expected range.
Potential failure — the observed behavior resembles patterns that historically occurred before infrastructure failures.
This changes the monitoring workflow from:
Metric → Threshold → Alert
to:
Metrics → Feature Engineering → ML Model → Failure Probability → Preventive Action
Proposed Architecture
A cloud failure prediction pipeline can be designed using several AWS services. Infrastructure metrics can be collected through Amazon CloudWatch. The historical metrics can be stored for analysis and model training. A preprocessing pipeline can clean the data, handle missing values, normalize measurements, and generate time-based features.
The processed dataset can then be used to train a machine learning model. Depending on the available data, models such as Logistic Regression, Random Forest, XGBoost, Isolation Forest, or neural networks can be evaluated.
The trained model can generate a failure probability for incoming infrastructure data. If the probability crosses a predefined risk level, the system can generate an alert or initiate a predefined operational response.
A simplified architecture is:
Cloud Infrastructure → CloudWatch Metrics → Data Processing → Feature Engineering → ML Model → Failure Prediction → Alert/Automated Response
What Data Should Be Used?
The quality of the prediction system depends heavily on the quality of the operational data.
Useful metrics include CPU utilization, memory utilization, disk utilization, network throughput, request rate, response latency, HTTP error rate, process count, container health, and system load.
Time-based features are also important. Instead of using only the current CPU value, the model can use features such as the average CPU utilization during the previous five minutes, the maximum memory utilization during the previous ten minutes, and the rate at which latency is increasing.
For example, a CPU utilization of 75% by itself may not indicate a problem. However, CPU increasing from 45% to 75% while memory increases from 50% to 90% and latency doubles could represent a much stronger failure signal.
Feature Engineering
Raw monitoring data is rarely sufficient for machine learning. Feature engineering converts infrastructure measurements into meaningful predictive signals.
Rolling averages can capture recent system behavior. For example, a five-minute moving average can reduce short-term noise and identify sustained resource pressure.
Rate-of-change features can identify rapidly deteriorating conditions. If memory usage increases continuously over several intervals, the slope of the memory-usage curve can become an important feature.
Interaction features can also be useful. A combination of high CPU, high memory usage, and increasing latency may provide more information than any individual metric.
Machine Learning Approaches
There is no single algorithm that is guaranteed to work for every cloud environment. The appropriate model depends on the availability and quality of failure labels.
If historical failures are clearly labeled, supervised learning can be used. Classification algorithms such as Random Forest, XGBoost, and Logistic Regression can predict whether an infrastructure state is likely to result in a failure.
If failure labels are limited, anomaly detection becomes more practical. Algorithms such as Isolation Forest can learn what normal infrastructure behavior looks like and identify unusual observations.
For large time-series datasets, more advanced approaches such as LSTM networks, autoencoders, and other sequence models can be investigated because they can capture temporal relationships between observations.
A useful research experiment is to compare multiple models using the same dataset instead of assuming that a more complex model will automatically produce better results.
Evaluation Metrics
Accuracy alone is a poor metric for cloud failure prediction.
Infrastructure failures are usually rare compared with normal operating conditions. A model that predicts “no failure” for every observation could achieve very high accuracy while being completely useless.
Precision measures how many predicted failures were actually failures. Recall measures how many actual failures were successfully detected. F1-score balances precision and recall.
For operational systems, recall can be particularly important because missing a genuine failure can be more expensive than generating an additional warning.
Another important metric is lead time: how far in advance the model can identify an approaching failure.
For example, predicting a failure 30 seconds before it occurs may not provide enough time for corrective action, while predicting it 10 minutes earlier could allow an automated scaling or recovery mechanism to respond.
AWS Implementation
An AWS-based implementation can use Amazon CloudWatch as the primary source of infrastructure telemetry. Metrics can be collected from EC2 instances, containers, applications, or other monitored resources.
The historical data can be processed and prepared for model training. Amazon SageMaker can be used for machine learning experimentation, training, evaluation, and deployment when a managed ML workflow is required.
The prediction service can periodically evaluate new infrastructure observations. CloudWatch alarms and AWS notification or automation services can then be integrated with the prediction output.
The objective is not simply to deploy a machine learning model. The important part is creating a complete feedback loop:
Observe → Analyze → Predict → Alert → Respond → Learn
Example Scenario
Consider an application server experiencing gradually increasing traffic.
During normal operation, CPU utilization remains around 40–50%, memory usage remains stable, and average response latency is low.
As traffic increases, CPU rises to 70%, memory utilization starts increasing, and response latency begins to rise. A traditional threshold-based system may not generate an alert because none of the individual metrics has crossed its critical threshold.
A machine learning model can evaluate the combination and temporal trend of these metrics. If similar patterns have historically occurred before server failures, the model could assign a high failure probability.
The system can then generate an early warning, allowing an operator or automation system to scale the workload before the application becomes unavailable.
Research Questions
This problem provides several opportunities for experimentation.
One research question is whether machine learning can predict infrastructure failures earlier than traditional threshold-based monitoring.
A second question is which model performs best when infrastructure metrics are highly imbalanced and failures are rare.
A third question is whether combining multiple infrastructure metrics improves prediction compared with using CPU utilization alone.
Another important question is whether the prediction model remains reliable when workloads change. A model trained on one traffic pattern may perform poorly when the application experiences a completely different workload.
Challenges and Limitations
Failure prediction is not a solved problem. Cloud environments are dynamic, and infrastructure behavior can change because of deployments, traffic spikes, configuration changes, dependency failures, or external services.
False positives are another major challenge. If the system generates too many warnings, engineers may begin ignoring alerts. This creates alert fatigue and reduces the practical value of the prediction system.
Data quality is equally important. Missing metrics, inconsistent sampling intervals, insufficient failure examples, and incorrect labels can significantly reduce model performance.
There is also a difference between predicting a failure and identifying its root cause. A model may correctly predict that a server is at high risk without explaining whether the cause is memory leakage, excessive traffic, a database bottleneck, or an application defect.
Future Improvements
A more advanced system could combine failure prediction with automated remediation. For example, the system could predict increasing infrastructure risk and trigger a controlled scaling action before service degradation occurs.
Another improvement would be explainable AI. Instead of producing only a probability such as “Failure risk: 87%,” the system could identify the major contributing signals, such as increasing memory utilization, rising latency, and abnormal network traffic.
The system could also continuously retrain as new operational data becomes available. This would help the model adapt to changing workloads and infrastructure configurations.
A further research direction is combining machine learning with large language models and AI agents. An agent could consume monitoring signals, investigate related logs, identify possible causes, recommend remediation steps, and require human approval before executing high-impact infrastructure changes.
Conclusion
Cloud monitoring has traditionally focused on detecting problems after they occur. Machine learning introduces the possibility of predicting infrastructure failures before they become critical incidents.
The key idea is not to replace traditional monitoring but to extend it. Threshold-based alerts remain useful for known conditions, while machine learning can identify complex patterns across multiple metrics and over time.
A practical predictive cloud-monitoring system can therefore combine CloudWatch telemetry, feature engineering, machine learning, anomaly detection, and automated alerting. The most important measure of success is not simply model accuracy, but whether the system can provide reliable early warnings with enough lead time for engineers or automation systems to act.
The long-term goal is a shift from reactive cloud operations toward proactive and intelligent infrastructure management: detecting risks early, understanding why they occur, and responding before users experience a failure.
Enjoyed reading this content? Let the author know!
Your likes, comments, shares, and saves help creators reach more builders.

Loading recommendations
Loading article