

AWS Emulator Deep Dive: A Fully Observable Serverless App Locally
I ran a 12-service serverless order app on my laptop with AWS Emulator, then traced every order from click to notification in Grafana with OpenTelemetry. Here is the build, the limits I hit, and what I learned.

The day AWS Emulator went GA, I knew exactly what I wanted to try. Not a "create a bucket, list the bucket" test. I wanted to throw a real event-driven serverless application at it, with Lambda, Step Functions, EventBridge, SQS, SNS, DynamoDB and friends all talking to each other, and then see every hop of every request in Grafana.
So I did. This post walks through what I built, how the architecture fits together, the limitations I ran into (there were some fun ones), and a full user journey with screenshots of what one order looks like from the click to the final notification.
Spoiler: it works, and I'm hooked.
What is AWS Emulator?
AWS Emulator is a local emulator of the AWS APIs that you run on your own machine. The AWS CLI, the AWS SDKs and your coding agents talk to it over a local HTTPS endpoint on
127.0.0.1:9297 , using the same API calls they would make against AWS. It has no service fee, it doesn't need an AWS account, and its source is on GitHub .Three things made me want to push on it:
- It's generated from the same Smithy API models the AWS SDKs use, so requests and errors come back in the same shape as on AWS.
- AWS publishes a per-service fidelity score with every release. You can see exactly which behaviors are verified against real AWS and which ones aren't there yet.
- Every copy you start gets its own port, keys and in-memory state. That's a great fit for coding agents and CI jobs that need a clean world every time.
I'm on version 1.0.322 (commit
7753983 ) for everything in this post.What I built
The app is an order-fulfillment system for a fictional store, AnyCompany Retail. A customer places an order in a web storefront. The order flows through inventory reservation, payment, shipping and customer notifications, and every step can fail in a realistic way.
I gave myself four goals:
- Fully serverless and multi-service. As many AWS services as the request path naturally needs, wired together the way I'd do it on AWS.
- Runs entirely on my laptop. No AWS account, no deploys, nothing listening beyond
127.0.0.1.
- Instrumented with OpenTelemetry. Traces, logs and metrics going into a local, containerized Grafana stack.
- Failure on purpose. Six scenarios I can trigger with one click: happy path, declined card, slow payment gateway, flaky gateway that needs a retry, out of stock, and a poison message that ends up in a dead-letter queue.
In the end that came to 12 AWS services: Lambda, Step Functions, EventBridge, SQS, SNS, DynamoDB, S3, Secrets Manager, KMS, IAM, CloudWatch Logs and X-Ray.
The overall architecture
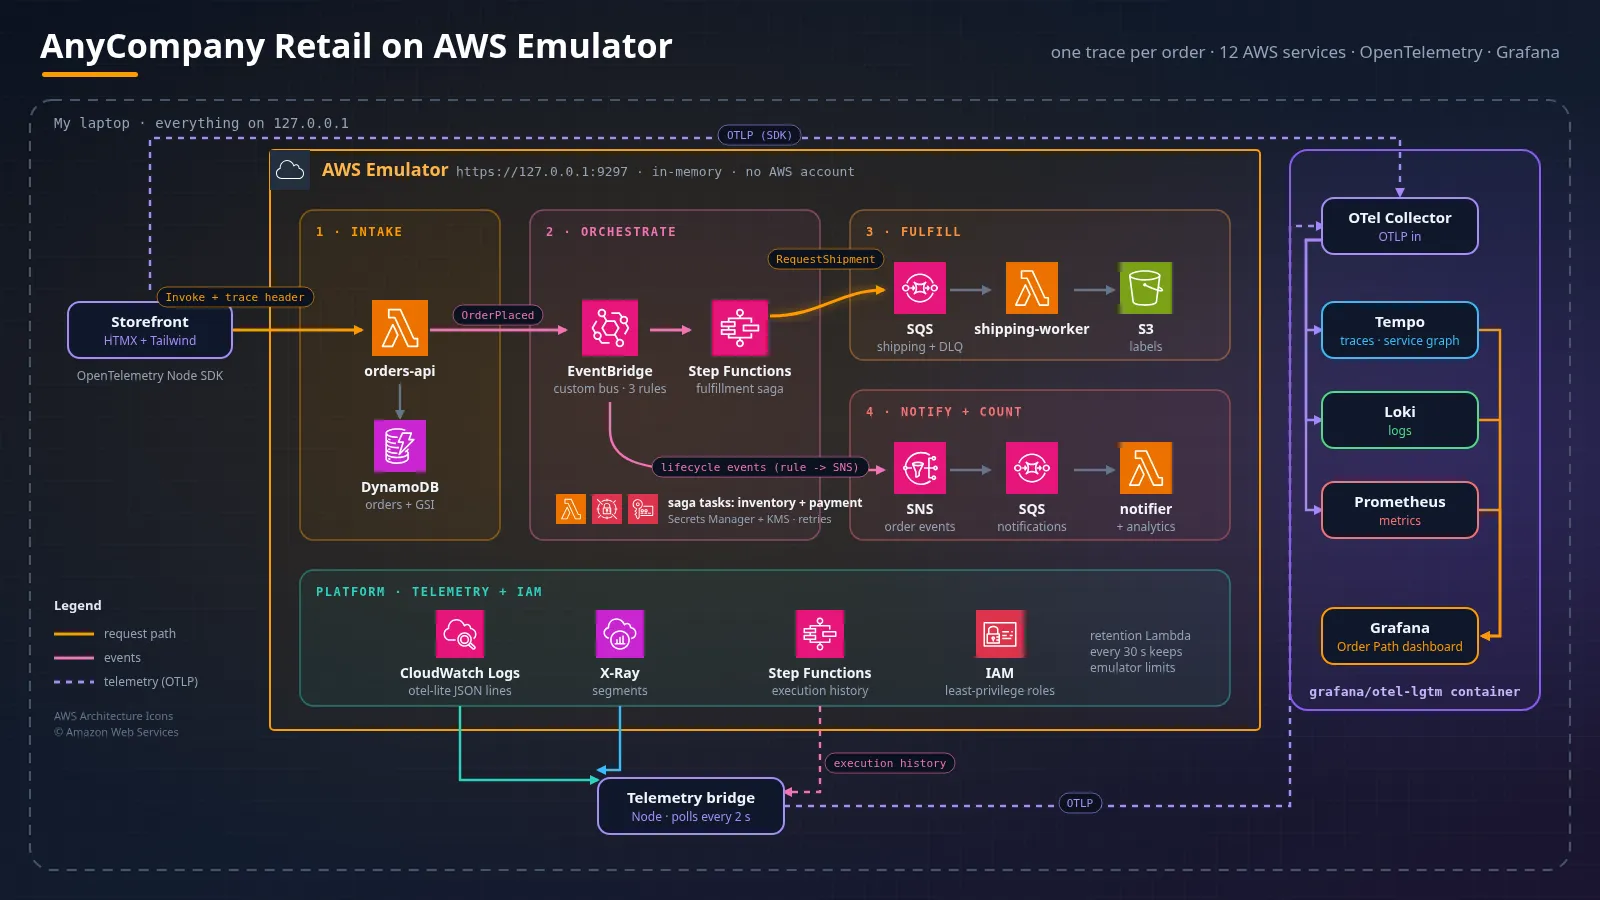
Here's the flow in plain words:
- The storefront is a small Node app (HTMX and Tailwind, no React). When I click "Place order", it invokes the
orders-apiLambda function directly.
- orders-api validates the order, reads prices from DynamoDB, writes the order as
PENDING, and publishes anOrderPlacedevent to a custom EventBridge bus.
- An EventBridge rule starts the fulfillment saga in Step Functions. The saga reserves inventory (a DynamoDB transaction in the
inventoryfunction), authorizes payment (thepaymentfunction reads its gateway key from Secrets Manager, encrypted with KMS), drops the order on the shipping queue, and emitsOrderConfirmed. If payment fails, it runs a compensation step that releases the reserved stock, marks the orderFAILED, and emitsOrderFailed.
- The shipping-worker consumes the queue, writes a shipping label to S3, marks the order
SHIPPED, and emitsOrderShipped. After three failed receives, an undeliverable address moves to the dead-letter queue.
- A second EventBridge rule sends the lifecycle events to an SNS topic. The topic fans out to an SQS queue consumed by the notifier, which writes customer receipts to S3.
- A third rule copies
OrderPlacedto an analytics queue, which keeps daily counters in DynamoDB.
Every function, the state machine and the event bus has its own least-privilege IAM role. Provisioning is a TypeScript script using the AWS SDK. It creates or updates everything in about 7.5 seconds on a fresh emulator, and it's safe to run again.
Why didn't I use API Gateway in front of
orders-api ? I checked the fidelity scores before writing a single line of code. In this release, the cross-service tests that pair Lambda with API Gateway passed 33 of 81 for HTTP APIs and 107 of 264 for REST APIs. Calling Lambda directly from the storefront was the most consistent front door, and it still gave me a real OpenTelemetry root span for every click.The big lesson: telemetry can't leave a Lambda function
This is the part I found most interesting. I went in assuming I'd drop the OpenTelemetry SDK (or ADOT) into each function and point it at my Collector. That doesn't work, and the reason is a design choice in the emulator, not a bug.
AWS Emulator runs Node functions on an embedded QuickJS engine (Python runs on RustPython), inside the emulator's own process. Reading its source, I found that a function's outbound HTTP can only reach the emulator itself:
The destination is ALWAYS this emulator... No host name is resolved and no socket is opened on any path.
That's a smart sandboxing decision, but it means a function can't send OTLP to Grafana. So I flipped the problem around: telemetry leaves through the services the emulator does provide
- Inside the functions, I wrote a tiny tracer called
otel-lite. It uses no Node built-ins, so it runs on QuickJS. Every span and log record becomes one JSON line on stdout, using OpenTelemetry field names and semantic conventions. The emulator stores those lines in CloudWatch Logs, just like Lambda does.
- A telemetry bridge runs next to the emulator as a normal Node process. Every 2 seconds it reads the CloudWatch Logs lines, the X-Ray segments the emulator records for each invocation, the Step Functions execution history, queue depths, inventory levels and the emulator's own log. It sends all of that to the Collector as real OTLP, keeping the original IDs and timestamps.
- The storefront uses the full OpenTelemetry Node SDK, so every order starts as a proper root span.
Stitching the trace together was the puzzle I enjoyed most:
- The storefront sends an
X-Amzn-Trace-Idheader built from its OpenTelemetry span. The emulator honors it, so X-Ray segments fororders-apiland in my trace.
- Trace context then rides along in a
_traceenvelope: in the EventBridge event detail, the Step Functions input, and the SQS message body.
- When a queue, rule or state machine starts a fresh X-Ray trace, the function writes a small link record. The bridge uses it to move those X-Ray segments into the original trace.
- Step Functions states and the Lambda functions they invoke agree on span IDs through a shared deterministic hash. The
paymentfunction lands exactly under theAuthorizePaymentstate span, even though the two never talk to each other.
The result is one trace per order that crosses 9 services and has around 40 to 65 spans, depending on the scenario.
Other limitations I ran into (and how I worked around them)
I wrote small probe scripts before building the app, and kept a list as I went. None of these are surprising for a brand-new emulator, and the fidelity reports are upfront about gaps. Each one taught me something about how the emulator thinks.
What I hit | What I did about it |
|---|---|
Bundling the AWS SDK into the function zip fails ( Cannot find module 'node:process' ). The runtime supplies @aws-sdk/* itself. | esbuild marks @aws-sdk/* external, and the build fails if anything imports a node: module. |
The Step Functions execution store is capped at 64 MiB, shared by every state machine. That's about 640 executions of my saga. After that, EventBridge starts failing with ExecutionLimitExceeded . | Two state machine slots. Every 220 executions, an ops loop recreates the idle slot empty and points the EventBridge rule at it. |
S3 keeps at most 1,000 objects per bucket. | A retention function keeps the newest 500 documents, trims old orders and caps the dead-letter queue. |
A function can make at most 256 AWS SDK calls per invocation. The in-function S3 client also has no DeleteObjects . | Retention spends a 240-call budget per run and picks up where it left off next time. |
EventBridge Scheduler doesn't fire schedules. | The storefront's ops loop triggers retention every 30 seconds instead. |
Step Functions history stamps every event with the execution start time, so every state shows 0 ms. | The bridge derives each state's timing from the X-Ray window of the Lambda it invoked, and tags those spans aws.step_functions.timing=derived so nobody mistakes them for measured values. |
BatchGetItem through the runtime's DynamoDB document client returns no items inside a function (it works from outside). | Read each product with GetItem . |
SNS Publish isn't reachable from inside a function, and Step Functions has no sns:publish integration here. | Lifecycle events go EventBridge rule, then SNS topic, then SQS, then notifier. |
The SQS client follows the queue URL host, which points at real AWS. | Every SQS client sets useQueueUrlAsEndpoint: false . |
The emulator writes its generated credentials under $HOME/.aws/emulator . | My start script gives it a project-local HOME , so nothing touches ~/.aws . |
A few lessons came from my own side of the build:
- One all-zero trace ID breaks a whole batch. An Invoke without an active span sent an all-zero trace header. Tempo rejected every span in the same OTLP request because of that one ID. Now the storefront,
otel-liteand the bridge all refuse zero IDs.
- Background work needs its own root span. My load generator was inheriting the context of the UI request that restarted it. Hundreds of orders ended up in one trace, and Lambda's recursive-loop detection stopped
orders-api(77 failed orders in one run). Starting each generated order as a fresh root span fixed it.
- Tempo's metrics generator ignores late spans by default. Step Functions spans arrive after the execution finishes, so I raised the ingestion slack to 5 minutes. Otherwise they'd be missing from span metrics and the service graph.
One important reminder from AWS: the emulator doesn't evaluate IAM the way AWS does. My least-privilege roles are there because that's how I'd build it for real, not because the emulator proves they're correct. Test security on AWS.
The full user journey
Here's one session, captured with headless Chromium after the automated checks passed. The numbered callouts point at the parts I care about.
1. The storefront

Everything starts here. I pick a scenario (1), place the order (2), and can turn on background traffic (3) so the dashboards always have something to show. The orange button (4) jumps straight to the Grafana dashboard.
2. The order is accepted

The banner shows the order ID that
orders-api just stored in DynamoDB (1), plus a deep link to this exact order's trace in Grafana (2). The recent orders table refreshes every 2 seconds (3), so I can watch the status change live.3. The order ships
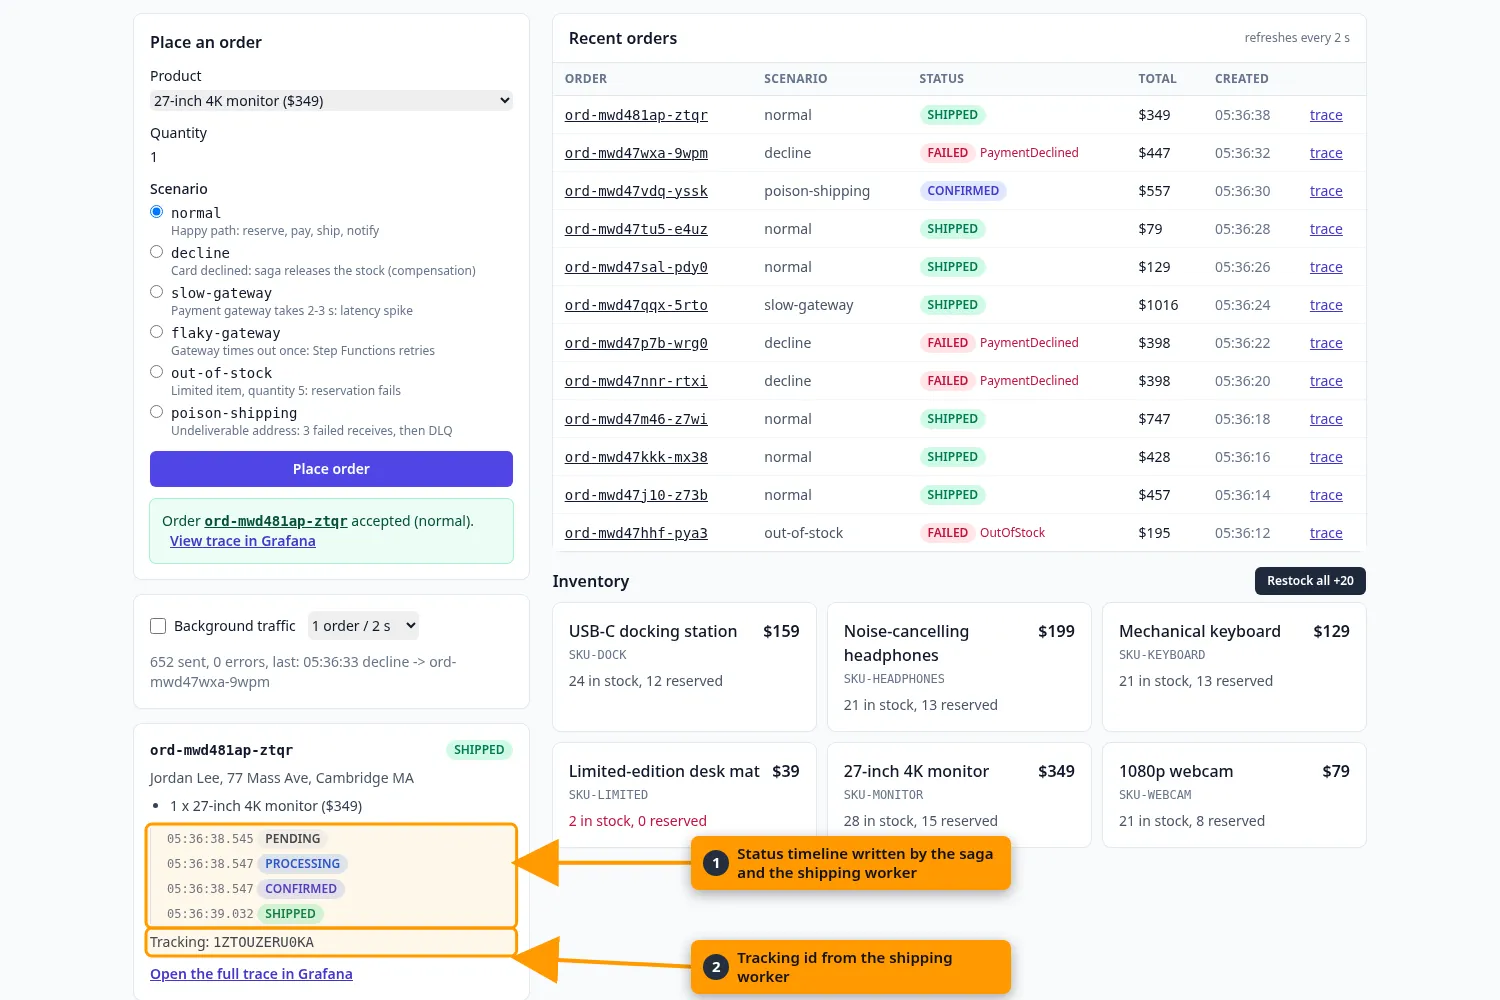
A second later, the timeline shows
PENDING , PROCESSING , CONFIRMED and SHIPPED (1). The saga and the shipping worker wrote each step, and the shipping worker added a tracking ID (2). That's 7 Lambda invocations, a state machine, three queues and an SNS topic, all on my laptop.4. A declined card

Now the fun part. A declined card fails the order with
PaymentDeclined (1), set by the saga's MarkFailed step. The reserved stock goes back on the shelf (2), because the saga's compensation step released it.5. The happy path, as one trace
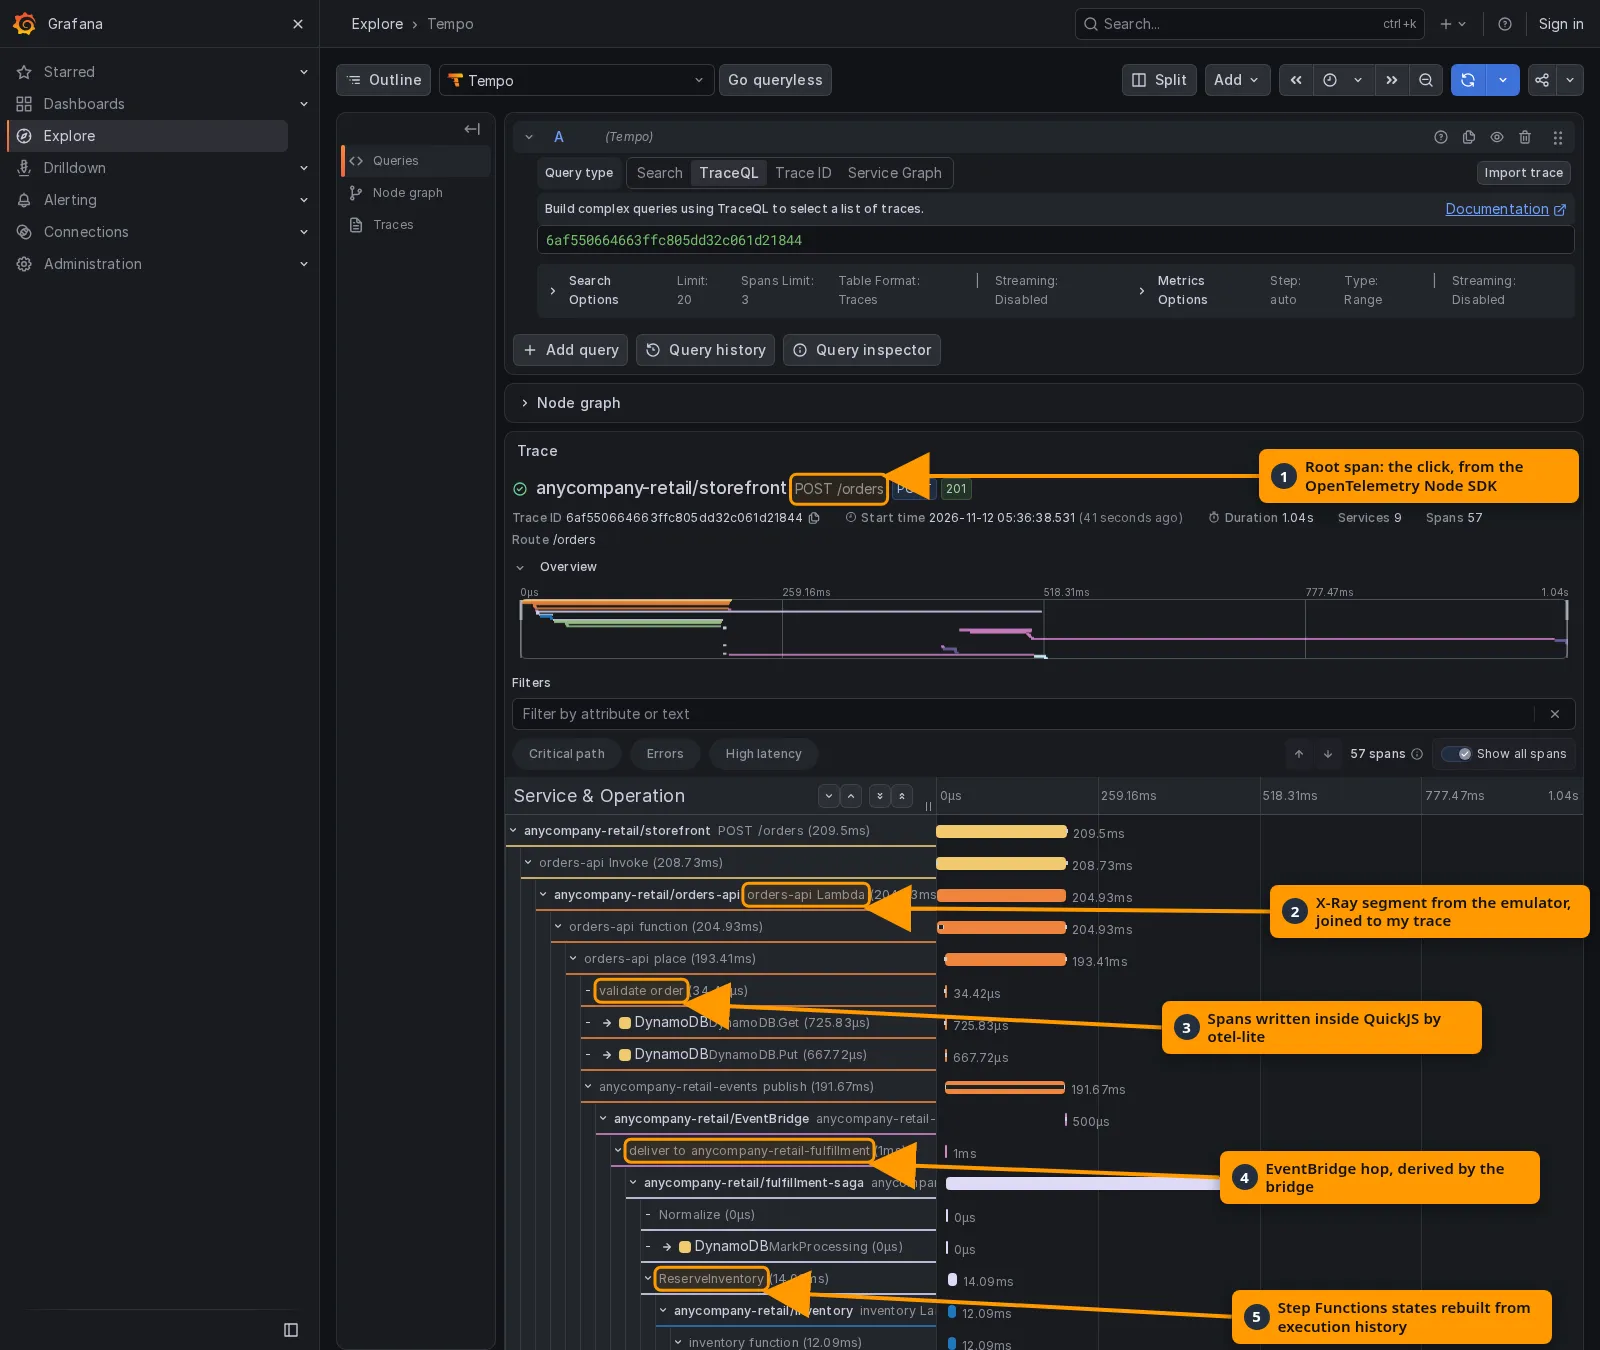
This is the screenshot that made me smile. The trace starts with my click in the storefront (1). The
orders-api span below it is an X-Ray segment the emulator recorded, joined into my trace (2). Under it are spans written inside QuickJS by otel-lite (3). Then the EventBridge hop (4) hands off to the Step Functions states (5), rebuilt from execution history.

Further down, the saga drops the order on the shipping queue (1). The shipping worker's consumer span sits right under it, parented across the queue (2), followed by the simulated carrier call (3).
6. The declined order's trace

Errors are easy to spot. The payment span is red (1). Right after it come the compensation step that gives the stock back (2) and the
OrderFailed event that fans out to the notifier (3). I didn't add any of these spans by hand: they come from the saga's own execution history.7. A retry, visible in the trace
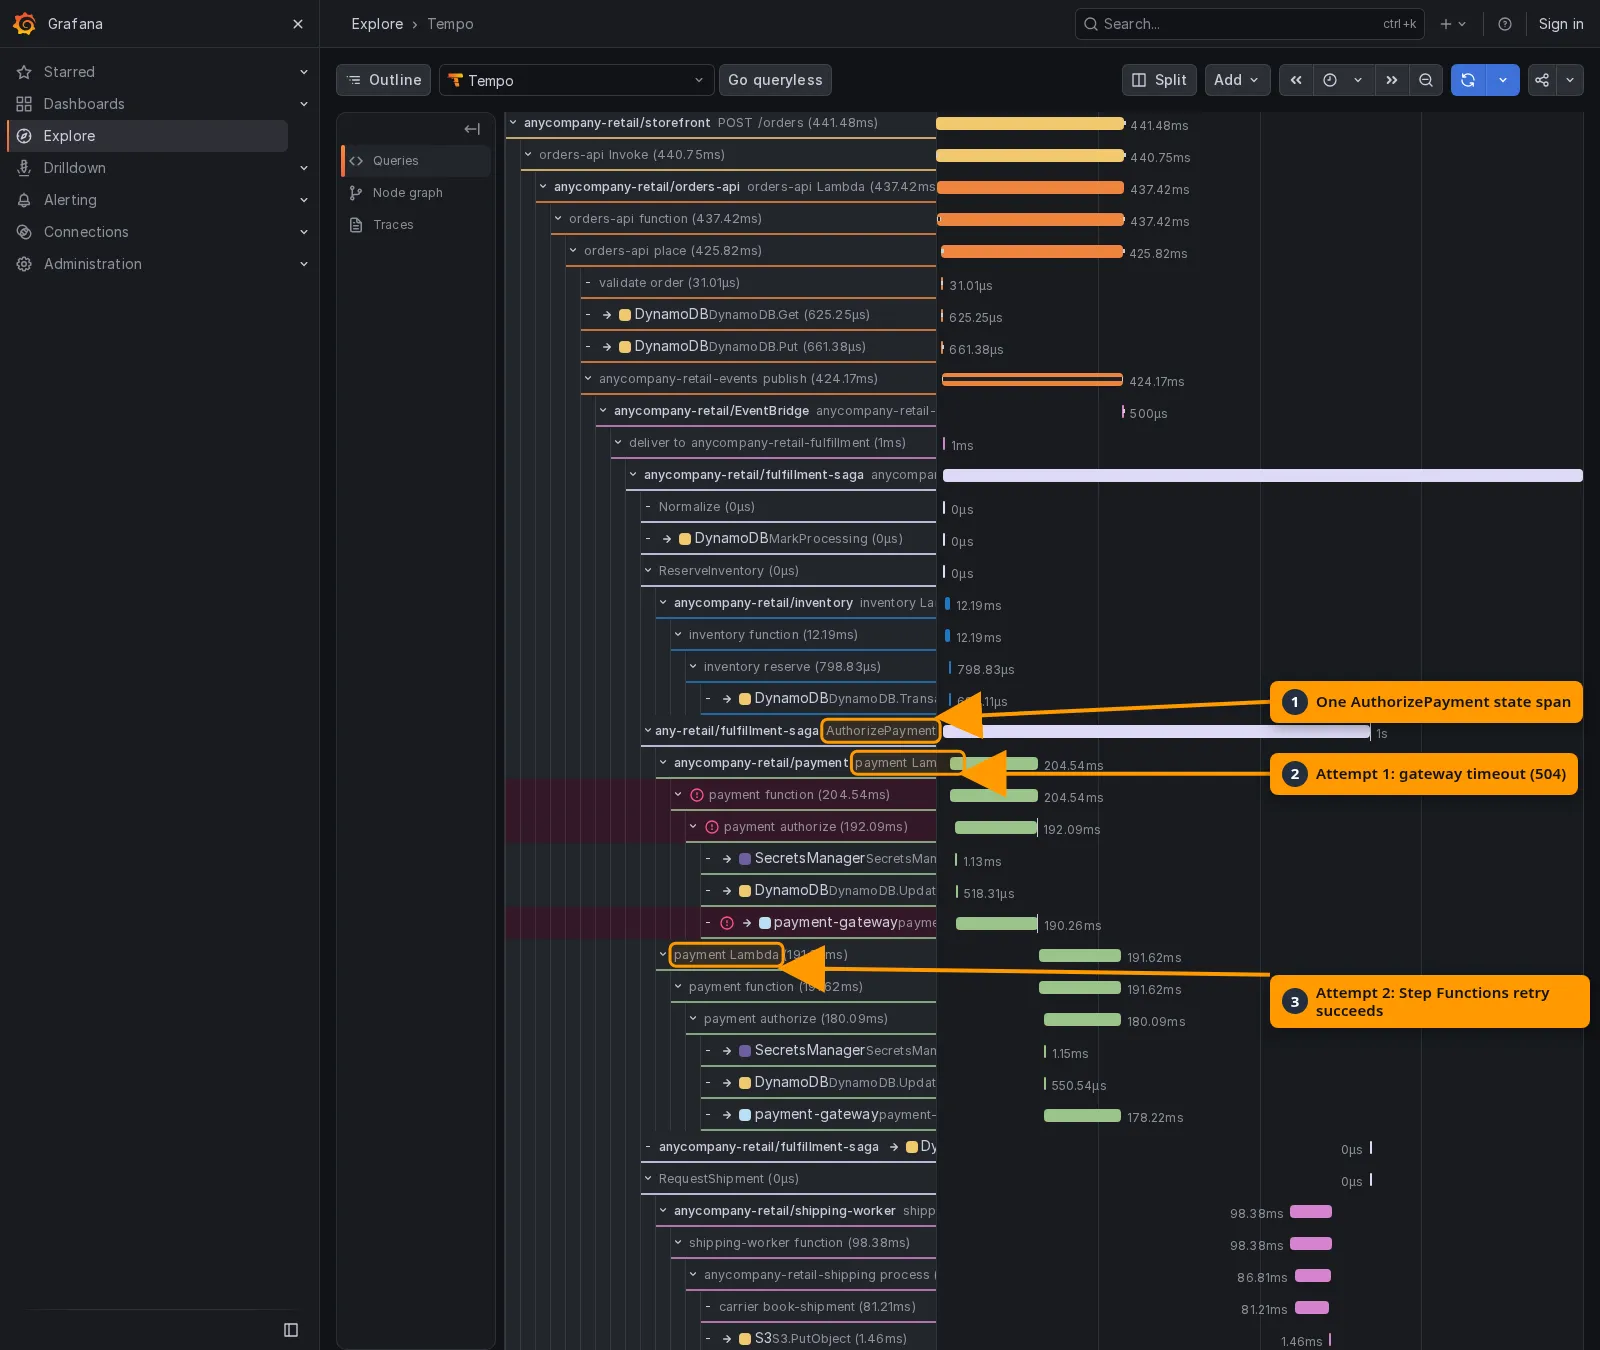
The flaky-gateway scenario times out on the first payment attempt. Step Functions retries it. In the trace, that's one
AuthorizePayment state span (1) with two payment invocations under it: the first one times out (2) and the second one succeeds (3). Seeing a retry this clearly is exactly what I want from a local test loop.8. Every log line for one order

One query in Loki for the trace ID (1) returns the log lines from every service that touched the order. That includes the notifier's own logs written inside the emulator (2), and even the Lambda platform
REPORT lines, which the bridge matches to the trace by request ID (3).9. The Order Path dashboard
I built the dashboard around the workload, not around individual services. The question it answers is "is the order path healthy?", from the click all the way to the notification.

The top row leads with the business outcome: the share of orders that finish (1) and how many poison messages are sitting in the dead-letter queue (2). Below that, Tempo builds the service graph from my spans (3), and the hop-by-hop table lists rate, error rate and p95 latency for every hop in request order (4). The error rates aren't zero, because the load generator injects declines, timeouts and poison messages on purpose.

The saga section shows p95 latency per state (1). The Lambda section breaks errors down by function and error type (2), parsed from the platform
REPORT lines and runtime errors.

At the bottom, I can see trace-correlated warnings from every service (1) and the emulator's own log (2). That second panel is how I found the Step Functions store limit in the first place: the emulator logs
ExecutionLimitExceeded when EventBridge can't start an execution.How I know it works
I wanted proof, not just pretty screenshots, so
npm run verify checks the whole thing end to end:- 56 checks across platform health, order outcomes for all six scenarios, trace completeness (one root, no orphan spans, the right spans present), log correlation in Loki, metrics in Prometheus, service graph edges, and background traffic health.
- A separate pass runs every query from all 26 dashboard panels and fails if one comes back empty.
- I ran it for about 30 minutes with background traffic. The saga rotated slots three times, there were no limit errors, and the emulator held steady at about 480 MB of memory.
One command brings the whole thing up (
npm run up ) and one tears it down ( npm run down ).Conclusion
I came in curious and left genuinely excited. In one session, I had a 12-service, event-driven serverless app running on my laptop, with a saga, retries, compensation, fan-out and a dead-letter queue. I could watch one order travel through all of it in a single trace. My feedback loop dropped from deploying to AWS and waiting, to clicking a button and seeing the result in Grafana a few seconds later.
The limitations are real, and I hit plenty of them. But every one of them showed up as a clear error message, a published fidelity score, or a tracked issue in the repo, so I never had to guess what was happening. That made working around them part of the fun. The biggest one, no sockets inside functions, pushed me into a telemetry design I actually like: functions write OpenTelemetry-shaped records, and a bridge turns the emulator's own data into OTLP.
What I want to try next:
- Re-run my probe scripts against each new emulator release, and drop workarounds as gaps close (API Gateway, DynamoDB Streams and Scheduler are at the top of my list).
- Point a coding agent at this setup and let it iterate on the saga locally, with Grafana as its feedback.
- Run the same code against real AWS and compare the traces side by side.
If you build on AWS, give the emulator an afternoon. Start small, check the fidelity scores for the services you use, and then try something ambitious. I'd love to hear what you build.
__
Enjoyed reading this content? Let the author know!
Your likes, comments, shares, and saves help creators reach more builders.

Loading recommendations
Loading article