
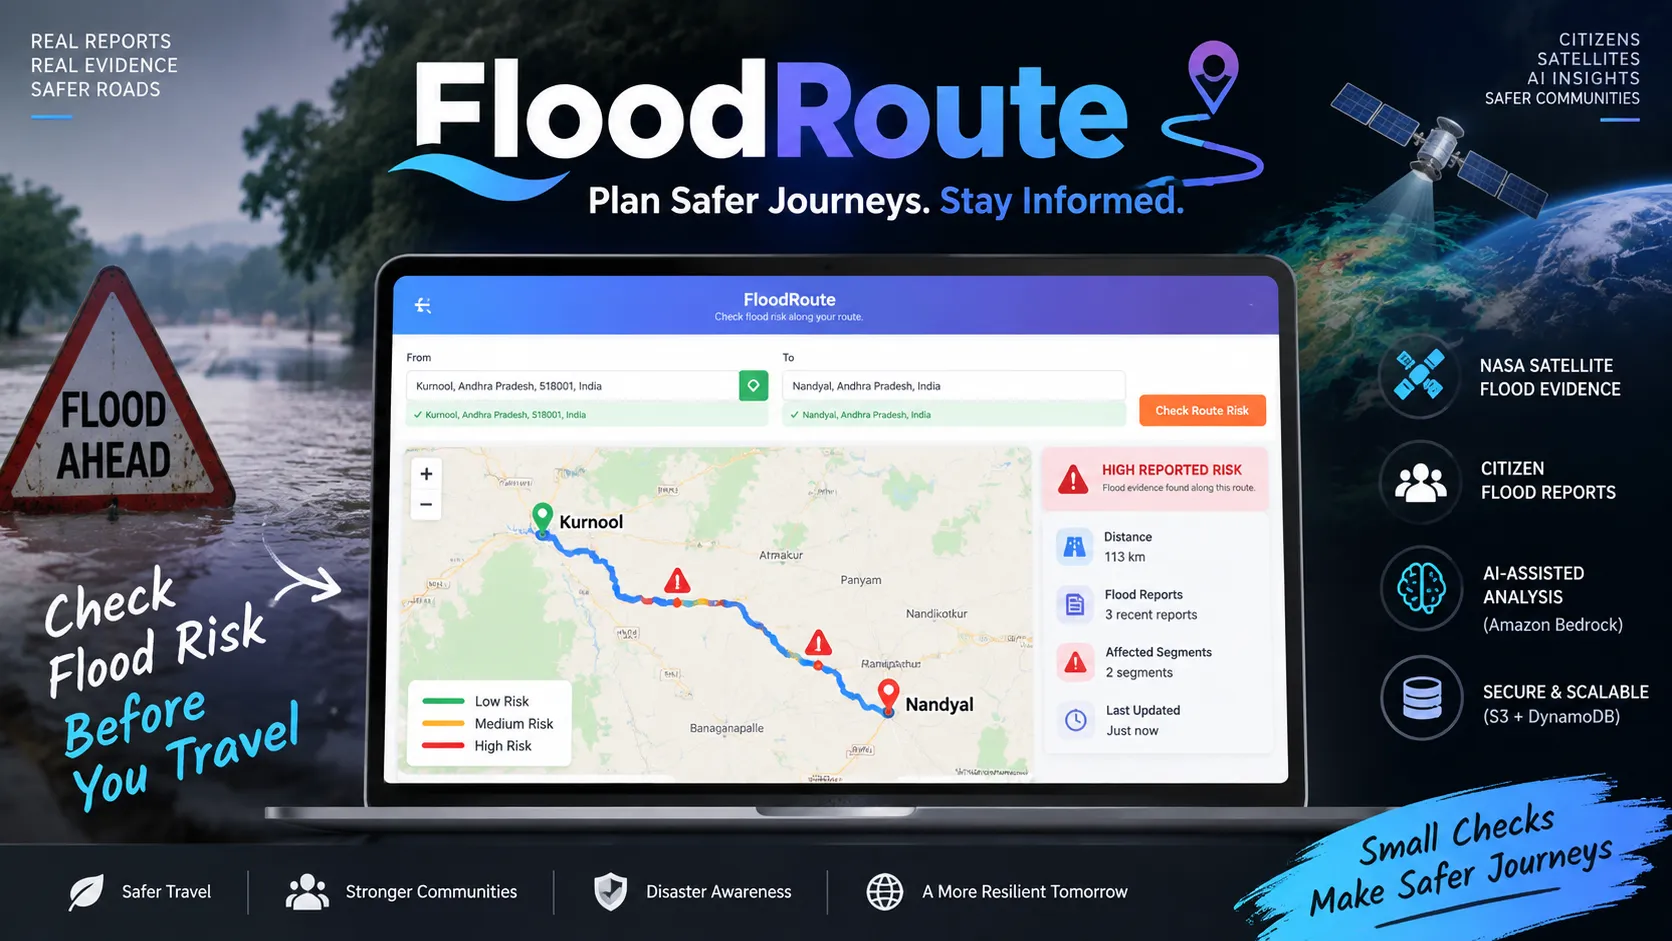
FloodRoute: Building Risk-Aware Navigation with Amazon Bedrock, AWS and NASA Satellite Data
How we built FloodRoute, a flood-aware navigation system that combines citizen reports, Amazon Bedrock, Amazon S3, Amazon DynamoDB, NASA VIIRS satellite evidence, and a deterministic risk engine to provide route-level flood risk insights.

Imagine you're about to travel from one city to another during the monsoon.
Your navigation application gives you a route, estimates the travel time, and tells you when you should arrive.
But there is another question that matters:
What flood-related evidence is available along my route right now?
Traditional navigation systems are primarily optimized for roads, distance, traffic, and travel time. During flooding, however, road conditions can change quickly, and information may come from sources that conventional navigation systems do not incorporate directly.
This led us to build FloodRoute — a flood-aware navigation prototype that combines:
- 🧑🤝🧑 Recent citizen flood reports
- 🤖 AI-assisted analysis using Amazon Bedrock
- 🛰️ NASA VIIRS satellite flood evidence
- 🗺️ Real route data
- 🗄️ Amazon DynamoDB
- 🪣 Amazon S3
- ⚙️ A deterministic route-risk engine
The important design decision was this:
We did not ask an LLM to decide whether a road is safe.
Instead, AI helps interpret unstructured reports, while the final route-risk classification is produced by a deterministic system using evidence, severity, freshness, and proximity.
1. The Problem
Flooding creates a difficult information problem.
A user might have:
- a route from Kurnool to Nandyal,
- several citizen reports,
- photographs of flooded roads,
- satellite flood observations,
- and reports of different ages and severities.
But simply collecting this information isn't enough.
We need to answer:
Which pieces of evidence are actually relevant to this route?
For example:
1
2
3
4
5
6
7
8
9
10
11
12
13
14
Report A
HIGH severity
10 minutes old
80 meters from route

Report B
LOW severity
5 hours old
2.4 km from route

Report C
MEDIUM severity
35 minutes old
120 meters from route
These reports should not have equal influence.
A recent high-severity report close to the route is much more relevant than an old report several kilometers away.
That became the foundation of our risk engine.
2. Our Solution — FloodRoute
FloodRoute allows a user to:
- Enter an origin.
- Enter a destination.
- Generate a real road route.
- Analyze recent flood reports around that route.
- Analyze available satellite flood evidence.
- Combine the evidence.
- Display route-level reported risk.
The user sees classifications such as:
1
2
3
LOW_REPORTED_RISK
MEDIUM_REPORTED_RISK
HIGH_REPORTED_RISK
We intentionally use the term reported risk.
FloodRoute does not claim:
"This road is definitely flooded."
Instead, it communicates:
"Available evidence indicates a higher reported level of flood risk around this route."
This distinction is important when building systems that influence real-world decisions.
3. High-Level Architecture
The system is divided into five major layers.
1
2
3
4
5
6
7
8
9
10
11
12
13
14
15
16
17
18
19
20
21
22
23
24
25
26
27
28
29
30
31
32
33
34
35
36
37
38
39
40
41
42
43
44
                    ┌──────────────────────┐
                    │      React App       │
                    │                      │
                    │ Origin → Destination │
                    │ Route + Risk Map     │
                    └──────────┬───────────┘
                               │
                               ▼
                    ┌──────────────────────┐
                    │     FastAPI API      │
                    │                      │
                    │ /reports             │
                    │ /reports/near-route  │
                    │ /flood/analyze-route │
                    └───────┬───────┬──────┘
                            │       │
              ┌─────────────┘       └──────────────┐
              ▼                                    ▼
     ┌─────────────────┐                  ┌─────────────────┐
     │ Citizen Reports │                  │ NASA VIIRS      │
     │                 │                  │ Flood Evidence  │
     └────────┬────────┘                  └────────┬────────┘
              │                                    │
              ▼                                    │
     ┌─────────────────┐                           │
     │ Amazon Bedrock  │                           │
     │ Text + Image AI │                           │
     └────────┬────────┘                           │
              │                                    │
              └──────────────┬─────────────────────┘
                             ▼
                  ┌──────────────────────┐
                  │ Evidence Aggregator  │
                  │                      │
                  │ Deterministic Risk   │
                  │ Engine               │
                  └──────────┬───────────┘
                             │
                             ▼
                  ┌──────────────────────┐
                  │ Route Risk Result    │
                  │                      │
                  │ LOW / MEDIUM / HIGH  │
                  └──────────────────────┘
The application uses AWS services where they provide a clear architectural benefit rather than adding AWS services simply for the sake of using them.
4. Why We Used Amazon Bedrock
Citizen reports are not structured data.
A user might submit:
"Road is completely covered with water and bikes are struggling to pass."
Another user might upload:
📷 A photograph showing water covering a road.
A traditional rule-based system would struggle to extract consistent information from this.
We therefore use Amazon Bedrock for AI-assisted report analysis.
The AI can help extract structured information such as:
1
2
3
4
5
6
7
{
  "condition": "FLOODED",
  "severity": "HIGH",
  "vehicle_impact": "TWO_WHEELERS_LIKELY_AFFECTED",
  "flood_detected": true,
  "confidence": 0.87
}
This converts an unstructured citizen report into information our application can process.
5. But We Don't Let the LLM Decide the Final Risk
This was one of our most important architectural decisions.
A tempting design would be:
1
2
3
4
5
User Route
     ↓
LLM
     ↓
"Safe" / "Unsafe"
We deliberately avoided that.
Instead:
1
2
3
4
5
6
7
8
9
Citizen report
      ↓
Amazon Bedrock
      ↓
Structured evidence
      ↓
Deterministic risk engine
      ↓
Route risk
The AI performs interpretation.
The deterministic engine performs the final calculation.
This gives us:
- reproducibility
- explainability
- easier testing
- predictable behavior
- reduced dependence on model output
It also means that changing the AI model does not automatically change our risk policy.
6. Making Fresh Reports Matter More
Not every report should have the same weight.
Flood conditions can change rapidly.
Our freshness model therefore reduces the influence of older reports.
We use the following freshness factors:
| Report age | Freshness factor |
|---|---|
| 0–30 minutes | 1.0 |
| 30–120 minutes | 0.7 |
| 2–6 hours | 0.4 |
| 6+ hours | 0.1 |
This means a report from eight minutes ago can have significantly more influence than a report from several hours ago.
7. Route Proximity Matters
A flood report doesn't necessarily affect the entire route.
Consider:
1
2
3
4
5
6
7
              Report
                ●
                │
                │ 2.5 km
                │
════════════════════════════
          User Route
That report should not have the same importance as:
1
2
3
4
5
6
          ● Report
          │
          │ 80 m
          │
════════════════════════════
        User Route
FloodRoute therefore performs geographic proximity calculations using route coordinates and report coordinates.
Our default route-analysis radius is:
1
100 meters
We use the Haversine/geospatial distance between points to determine whether reports are relevant to a route.
8. Why DynamoDB?
Flood reports are naturally represented as structured documents.
A report contains information such as:
1
2
3
4
5
6
7
8
9
10
11
12
{
  "report_id": "R001",
  "latitude": 15.8281,
  "longitude": 78.0373,
  "condition": "FLOODED",
  "severity": "HIGH",
  "description": "Water covering road",
  "vehicle_impact": "TWO_WHEELERS_LIKELY_AFFECTED",
  "created_at": "2026-09-20T10:15:00Z",
  "status": "ACTIVE",
  "source": "CITIZEN"
}
We use Amazon DynamoDB to persist these reports.
The application retrieves active reports and performs route-proximity filtering in the application layer.
For our hackathon-scale workload, this approach keeps the architecture simple while leaving room for a more specialized geospatial architecture at larger scale.
9. Why Amazon S3?
Citizen reports can contain images.
Instead of storing binary image data directly in DynamoDB, we store images in Amazon S3.
Our object structure follows a pattern such as:
1
2
3
reports/
    R001/
        uuid-image.jpg
The S3 bucket is intended to remain private.
We also validate:
- file type
- file extension
- content signature
- maximum file size
The application does not expose the bucket publicly.
10. Adding a Second Evidence Source: NASA
Citizen reports have an important limitation:
They only represent what people have reported.
We wanted a second source of evidence.
FloodRoute therefore integrates the NASA VIIRS Global Flood Product.
The NASA product provides satellite-derived flood evidence at approximately 250-meter resolution.
This gives us a completely different type of signal:
1
2
3
4
5
Citizen evidence
       +
Satellite evidence
       ↓
Unified evidence
This is particularly interesting because the two sources have different strengths.
Citizen reports
Can provide:
- local observations
- descriptions
- vehicle impact
- photographs
- very recent information
Satellite evidence
Can provide:
- broader spatial coverage
- independent evidence
- observations even where no citizen has submitted a report
11. We Had to Be Careful With Satellite Data
Satellite flood products operate at an area scale.
Therefore, we do not claim:
"100% of this road is flooded."
Instead, FloodRoute reports something like:
NASA flood evidence overlaps 100% of the tested route.
That wording is important.
A 250-meter satellite observation does not prove that a specific individual road segment is physically flooded at this exact moment.
It is evidence that must be interpreted appropriately.
12. Combining Citizen + NASA Evidence
The final system combines two independent evidence streams.
1
2
3
4
5
6
7
8
9
10
11
12
13
14
15
16
17
Citizen Risk
     │
     ├── Severity
     ├── Freshness
     └── Route proximity
             │
             ▼
       Citizen Score
             │
             │
NASA Evidence ───────► NASA Score
             │
             ▼
      Evidence Aggregator
             │
             ▼
       Final Route Risk
The final risk uses the stronger available evidence rather than allowing one source to silently override the other.
For example:
1
2
3
4
Citizen evidence: MEDIUM
NASA evidence:     HIGH

Final: HIGH_REPORTED_RISK
Or:
1
2
3
4
Citizen evidence: HIGH
NASA evidence:     NONE

Final: HIGH_REPORTED_RISK
The entire process is deterministic and testable.
13. The API That Connects Everything
One of the important endpoints is:
1
POST /reports/near-route
The frontend sends route coordinates:
1
2
3
4
5
6
7
8
9
10
11
12
13
14
15
16
17
{
  "route": [
    {
      "latitude": 15.8281,
      "longitude": 78.0373
    },
    {
      "latitude": 15.8285,
      "longitude": 78.0381
    },
    {
      "latitude": 15.8290,
      "longitude": 78.0390
    }
  ],
  "radius_meters": 100
}
The backend returns route-level evidence:
1
2
3
4
5
6
7
8
9
10
11
12
13
14
15
{
  "success": true,
  "data": {
    "route_risk": "HIGH",
    "affected_segments": [
      {
        "latitude": 15.8285,
        "longitude": 78.0381,
        "risk": "HIGH",
        "reports": 3,
        "latest_report_minutes_ago": 8
      }
    ]
  }
}
This keeps the frontend relatively simple.
The frontend visualizes the result rather than implementing the risk policy itself.
14. Frontend: Real Routing and Small-Town Support
We wanted FloodRoute to work beyond major metropolitan areas.
The frontend uses:
- React
- Nominatim geocoding
- OSRM routing
- Leaflet-based map visualization
Users can search for locations such as:
1
2
3
4
5
6
7
8
Kurnool
Nandyal
Adoni
Dhone
Yemmiganur
Guntakal
Allagadda
Banaganapalle
We specifically tested small-town and locality searches because a disaster-response application shouldn't assume that users only travel between major cities.
15. A Small but Important Engineering Problem: Coordinate Formats
One integration issue we encountered was coordinate representation.
Routing APIs can return coordinates as:
1
[]while our backend contract expects:
1
2
3
4
{
  "latitude": 15.8281,
  "longitude": 78.0373
}
Sending the wrong representation can produce extremely confusing map behavior.
We therefore normalize route coordinates before sending them to the backend.
1
2
3
4
5
6
7
8
9
OSRM
↓
[]
↓
Normalization layer
↓
{ latitude, longitude }
↓
FastAPIThis seems small, but integration boundaries like this can cause some of the hardest-to-debug failures in multi-service applications.
16. Testing the System
We didn't want to rely only on a successful demo.
Our backend test suite covers:
- report creation
- report retrieval
- active reports
- S3 validation
- Bedrock integration behavior
- DynamoDB repository behavior
- route proximity
- freshness weighting
- risk calculation
- NASA integration
- unified evidence aggregation
- NASA failure isolation
Final backend test result:
1
58 passed
We also tested actual NASA data retrieval and route analysis.
For example, a test route returned:
1
2
3
Route distance:          1.18 km
NASA evidence overlap:   100%
HTTP status:              200
Again, this means that NASA flood evidence overlapped the tested route — not that every meter of the physical road was confirmed flooded.
17. Designing for Failure
One of the lessons from this project was that external services will fail.
NASA data may be unavailable.
Amazon Bedrock may return an error.
A user may upload an invalid image.
A database may temporarily fail.
We therefore designed failure paths rather than assuming everything always works.
For example:
1
2
3
4
5
6
7
Bedrock unavailable
       ↓
AI analysis fails
       ↓
Citizen-provided information retained
       ↓
Risk engine continues
Similarly:
1
2
3
4
5
6
7
NASA unavailable
       ↓
NASA evidence marked unavailable
       ↓
Citizen evidence continues
       ↓
Route analysis still works
This is especially important for applications where one external data source should not bring down the entire workflow.
18. Responsible AI
FloodRoute deals with a potentially high-impact situation: travel during flooding.
That means we need to be careful about what the system claims.
We deliberately avoid statements such as:
❌ "This road is safe."
❌ "This road is definitely flooded."
❌ "You can safely travel this route."
Instead, the application communicates evidence:
✅
LOW_REPORTED_RISK✅
MEDIUM_REPORTED_RISK✅
HIGH_REPORTED_RISKAnd includes the disclaimer:
Reported risk is based on available recent reports near the route and does not guarantee current road conditions.
This is one of the most important parts of our architecture.
The system supports human decision-making rather than pretending that a model can perfectly understand real-world road conditions.
19. What We Built With AWS
Our AWS architecture uses different services for different responsibilities.
| AWS Service | Role |
|---|---|
| Amazon Bedrock | AI-assisted analysis of citizen text/images |
| Amazon S3 | Flood-report image storage |
| Amazon DynamoDB | Structured flood-report persistence |
| AWS IAM | Secure service authorization |
| AWS SDK / boto3 | Backend integration |
External services:
| Service | Role |
|---|---|
| NASA VIIRS | Satellite flood evidence |
| Nominatim | Geocoding |
| OSRM | Route generation |
| Vercel | Frontend deployment |
| Render | FastAPI deployment |
The important architectural principle was:
Each service has a specific responsibility.
We didn't introduce AI into components where deterministic logic was more appropriate.
20. Deployment Architecture
Our deployed architecture looks like:
1
2
3
4
5
6
7
8
9
10
11
12
13
14
15
16
17
18
19
20
21
22
23
24
                  Internet
                     │
                     ▼
             ┌───────────────┐
             │    Vercel     │
             │ React Frontend│
             └───────┬───────┘
                     │ HTTPS
                     ▼
             ┌───────────────┐
             │    Render     │
             │ FastAPI       │
             └───────┬───────┘
                     │
          ┌──────────┼──────────┐
          ▼          ▼          ▼
       Bedrock      S3      DynamoDB
          │
          │
          └──────────────┐
                         ▼
                    Risk Engine

                + NASA VIIRS
This allowed us to demonstrate the application through a publicly accessible frontend while keeping the backend API separate.
21. What We Learned
Building FloodRoute taught us several lessons beyond simply connecting APIs.
1. AI shouldn't make every decision
LLMs are excellent for interpreting unstructured information.
They aren't necessarily the right component for deterministic policy decisions.
2. Freshness matters
A report from five minutes ago and a report from five hours ago should not be treated equally when conditions can change rapidly.
3. Multiple evidence sources are stronger than a single signal
Citizen reports and satellite data provide different perspectives.
Combining them creates a richer evidence model.
4. Failure handling is part of the architecture
External APIs fail.
AI services fail.
Data can be missing.
A resilient application needs to continue operating gracefully.
5. Responsible communication matters
For systems connected to real-world safety, the wording of the output can be just as important as the algorithm.
22. What's Next?
FloodRoute is currently a prototype, but there are several directions we would explore next.
Alternative route comparison
Instead of only evaluating one route:
1
Route A → HIGH_REPORTED_RISK
the system could evaluate:
1
2
3
Route A → HIGH_REPORTED_RISK
Route B → MEDIUM_REPORTED_RISK
Route C → LOW_REPORTED_RISK
while still showing distance and travel-time tradeoffs.
Better geospatial infrastructure
At larger scale, we would move beyond application-side filtering and introduce a more specialized geospatial architecture.
Historical flood analytics
Historical satellite and citizen reports could help identify recurring flood-prone areas.
Better report verification
Reports could be cross-checked using:
- multiple nearby reports
- image consistency
- temporal consistency
- satellite observations
Offline/low-connectivity support
Disaster scenarios often involve unreliable connectivity, making offline or low-bandwidth experiences another important direction.
23. Try FloodRoute
🌐 Live Application
Imagine you're about to travel from one city to another during the monsoon.
Your navigation application gives you a route, estimates the travel time, and tells you when you should arrive.
But there is another question that matters:
> **What flood-related evidence is available along my route right now?**
Traditional navigation systems are primarily optimized for roads, distance, traffic, and travel time. During flooding, however, road conditions can change quickly, and information may come from sources that conventional navigation systems do not incorporate directly.
This led us to build **FloodRoute** — a flood-aware navigation prototype that combines:
* 🧑🤝🧑 Recent citizen flood reports
* 🤖 AI-assisted analysis using **Amazon Bedrock**
* 🛰️ NASA VIIRS satellite flood evidence
* 🗺️ Real route data
* 🗄️ Amazon DynamoDB
* 🪣 Amazon S3
* ⚙️ A deterministic route-risk engine
The important design decision was this:
> **We did not ask an LLM to decide whether a road is safe.**
Instead, AI helps interpret unstructured reports, while the final route-risk classification is produced by a deterministic system using evidence, severity, freshness, and proximity.
***
# 1. The Problem
Flooding creates a difficult information problem.
A user might have:
* a route from Kurnool to Nandyal,
* several citizen reports,
* photographs of flooded roads,
* satellite flood observations,
* and reports of different ages and severities.
But simply collecting this information isn't enough.
We need to answer:
> **Which pieces of evidence are actually relevant to this route?**
For example:
```
Report A
HIGH severity
10 minutes old
80 meters from route
Report B
LOW severity
5 hours old
2.4 km from route
Report C
MEDIUM severity
35 minutes old
120 meters from route
```
These reports should not have equal influence.
A recent high-severity report close to the route is much more relevant than an old report several kilometers away.
That became the foundation of our risk engine.
***
# 2. Our Solution — FloodRoute
FloodRoute allows a user to:
1. Enter an origin.
2. Enter a destination.
3. Generate a real road route.
4. Analyze recent flood reports around that route.
5. Analyze available satellite flood evidence.
6. Combine the evidence.
7. Display route-level reported risk.
The user sees classifications such as:
```
LOW_REPORTED_RISK
MEDIUM_REPORTED_RISK
HIGH_REPORTED_RISK
```
We intentionally use the term **reported risk**.
FloodRoute does **not** claim:
> "This road is definitely flooded."
Instead, it communicates:
> "Available evidence indicates a higher reported level of flood risk around this route."
This distinction is important when building systems that influence real-world decisions.
***
# 3. High-Level Architecture
The system is divided into five major layers.
```
┌──────────────────────┐
│ React App │
│ │
│ Origin → Destination │
│ Route + Risk Map │
└──────────┬───────────┘
│
▼
┌──────────────────────┐
│ FastAPI API │
│ │
│ /reports │
│ /reports/near-route │
│ /flood/analyze-route │
└───────┬───────┬──────┘
│ │
┌─────────────┘ └──────────────┐
▼ ▼
┌─────────────────┐ ┌─────────────────┐
│ Citizen Reports │ │ NASA VIIRS │
│ │ │ Flood Evidence │
└────────┬────────┘ └────────┬────────┘
│ │
▼ │
┌─────────────────┐ │
│ Amazon Bedrock │ │
│ Text + Image AI │ │
└────────┬────────┘ │
│ │
└──────────────┬─────────────────────┘
▼
┌──────────────────────┐
│ Evidence Aggregator │
│ │
│ Deterministic Risk │
│ Engine │
└──────────┬───────────┘
│
▼
┌──────────────────────┐
│ Route Risk Result │
│ │
│ LOW / MEDIUM / HIGH │
└──────────────────────┘
```
The application uses AWS services where they provide a clear architectural benefit rather than adding AWS services simply for the sake of using them.
***
# 4. Why We Used Amazon Bedrock
Citizen reports are not structured data.
A user might submit:
> "Road is completely covered with water and bikes are struggling to pass."
Another user might upload:
> 📷 A photograph showing water covering a road.
A traditional rule-based system would struggle to extract consistent information from this.
We therefore use **Amazon Bedrock** for AI-assisted report analysis.
The AI can help extract structured information such as:
```
{
"condition": "FLOODED",
"severity": "HIGH",
"vehicle_impact": "TWO_WHEELERS_LIKELY_AFFECTED",
"flood_detected": true,
"confidence": 0.87
}
```
This converts an unstructured citizen report into information our application can process.
***
# 5. But We Don't Let the LLM Decide the Final Risk
This was one of our most important architectural decisions.
A tempting design would be:
```
User Route
↓
LLM
↓
"Safe" / "Unsafe"
```
We deliberately avoided that.
Instead:
```
Citizen report
↓
Amazon Bedrock
↓
Structured evidence
↓
Deterministic risk engine
↓
Route risk
```
The AI performs interpretation.
The deterministic engine performs the final calculation.
This gives us:
* reproducibility
* explainability
* easier testing
* predictable behavior
* reduced dependence on model output
It also means that changing the AI model does not automatically change our risk policy.
***
# 6. Making Fresh Reports Matter More
Not every report should have the same weight.
Flood conditions can change rapidly.
Our freshness model therefore reduces the influence of older reports.
We use the following freshness factors:
| Report age | Freshness factor |
| -------------- | ---------------- |
| 0–30 minutes | 1.0 |
| 30–120 minutes | 0.7 |
| 2–6 hours | 0.4 |
| 6+ hours | 0.1 |
This means a report from eight minutes ago can have significantly more influence than a report from several hours ago.
***
# 7. Route Proximity Matters
A flood report doesn't necessarily affect the entire route.
Consider:
```
Report
●
│
│ 2.5 km
│
════════════════════════════
User Route
```
That report should not have the same importance as:
```
● Report
│
│ 80 m
│
════════════════════════════
User Route
```
FloodRoute therefore performs geographic proximity calculations using route coordinates and report coordinates.
Our default route-analysis radius is:
```
100 meters
```
We use the Haversine/geospatial distance between points to determine whether reports are relevant to a route.
***
# 8. Why DynamoDB?
Flood reports are naturally represented as structured documents.
A report contains information such as:
```
{
"report_id": "R001",
"latitude": 15.8281,
"longitude": 78.0373,
"condition": "FLOODED",
"severity": "HIGH",
"description": "Water covering road",
"vehicle_impact": "TWO_WHEELERS_LIKELY_AFFECTED",
"created_at": "2026-09-20T10:15:00Z",
"status": "ACTIVE",
"source": "CITIZEN"
}
```
We use **Amazon DynamoDB** to persist these reports.
The application retrieves active reports and performs route-proximity filtering in the application layer.
For our hackathon-scale workload, this approach keeps the architecture simple while leaving room for a more specialized geospatial architecture at larger scale.
***
# 9. Why Amazon S3?
Citizen reports can contain images.
Instead of storing binary image data directly in DynamoDB, we store images in **Amazon S3**.
Our object structure follows a pattern such as:
```
reports/
R001/
uuid-image.jpg
```
The S3 bucket is intended to remain private.
We also validate:
* file type
* file extension
* content signature
* maximum file size
The application does not expose the bucket publicly.
***
# 10. Adding a Second Evidence Source: NASA
Citizen reports have an important limitation:
> They only represent what people have reported.
We wanted a second source of evidence.
FloodRoute therefore integrates the **NASA VIIRS Global Flood Product**.
The NASA product provides satellite-derived flood evidence at approximately 250-meter resolution.
This gives us a completely different type of signal:
```
Citizen evidence
+
Satellite evidence
↓
Unified evidence
```
This is particularly interesting because the two sources have different strengths.
### Citizen reports
Can provide:
* local observations
* descriptions
* vehicle impact
* photographs
* very recent information
### Satellite evidence
Can provide:
* broader spatial coverage
* independent evidence
* observations even where no citizen has submitted a report
***
# 11. We Had to Be Careful With Satellite Data
Satellite flood products operate at an area scale.
Therefore, we do **not** claim:
> "100% of this road is flooded."
Instead, FloodRoute reports something like:
> **NASA flood evidence overlaps 100% of the tested route.**
That wording is important.
A 250-meter satellite observation does not prove that a specific individual road segment is physically flooded at this exact moment.
It is evidence that must be interpreted appropriately.
***
# 12. Combining Citizen + NASA Evidence
The final system combines two independent evidence streams.
```
Citizen Risk
│
├── Severity
├── Freshness
└── Route proximity
│
▼
Citizen Score
│
│
NASA Evidence ───────► NASA Score
│
▼
Evidence Aggregator
│
▼
Final Route Risk
```
The final risk uses the stronger available evidence rather than allowing one source to silently override the other.
For example:
```
Citizen evidence: MEDIUM
NASA evidence: HIGH
Final: HIGH_REPORTED_RISK
```
Or:
```
Citizen evidence: HIGH
NASA evidence: NONE
Final: HIGH_REPORTED_RISK
```
The entire process is deterministic and testable.
***
# 13. The API That Connects Everything
One of the important endpoints is:
```
POST /reports/near-route
```
The frontend sends route coordinates:
```
{
"route": [
{
"latitude": 15.8281,
"longitude": 78.0373
},
{
"latitude": 15.8285,
"longitude": 78.0381
},
{
"latitude": 15.8290,
"longitude": 78.0390
}
],
"radius_meters": 100
}
```
The backend returns route-level evidence:
```
{
"success": true,
"data": {
"route_risk": "HIGH",
"affected_segments": [
{
"latitude": 15.8285,
"longitude": 78.0381,
"risk": "HIGH",
"reports": 3,
"latest_report_minutes_ago": 8
}
]
}
}
```
This keeps the frontend relatively simple.
The frontend visualizes the result rather than implementing the risk policy itself.
***
# 14. Frontend: Real Routing and Small-Town Support
We wanted FloodRoute to work beyond major metropolitan areas.
The frontend uses:
* React
* Nominatim geocoding
* OSRM routing
* Leaflet-based map visualization
Users can search for locations such as:
```
Kurnool
Nandyal
Adoni
Dhone
Yemmiganur
Guntakal
Allagadda
Banaganapalle
```
We specifically tested small-town and locality searches because a disaster-response application shouldn't assume that users only travel between major cities.
***
# 15. A Small but Important Engineering Problem: Coordinate Formats
One integration issue we encountered was coordinate representation.
Routing APIs can return coordinates as:
```
[longitude, latitude]
```
while our backend contract expects:
```
{
"latitude": 15.8281,
"longitude": 78.0373
}
```
Sending the wrong representation can produce extremely confusing map behavior.
We therefore normalize route coordinates before sending them to the backend.
```
OSRM
↓
[longitude, latitude]
↓
Normalization layer
↓
{ latitude, longitude }
↓
FastAPI
```
This seems small, but integration boundaries like this can cause some of the hardest-to-debug failures in multi-service applications.
***
# 16. Testing the System
We didn't want to rely only on a successful demo.
Our backend test suite covers:
* report creation
* report retrieval
* active reports
* S3 validation
* Bedrock integration behavior
* DynamoDB repository behavior
* route proximity
* freshness weighting
* risk calculation
* NASA integration
* unified evidence aggregation
* NASA failure isolation
Final backend test result:
```
58 passed
```
We also tested actual NASA data retrieval and route analysis.
For example, a test route returned:
```
Route distance: 1.18 km
NASA evidence overlap: 100%
HTTP status: 200
```
Again, this means that NASA flood evidence overlapped the tested route — **not that every meter of the physical road was confirmed flooded.**
***
# 17. Designing for Failure
One of the lessons from this project was that external services will fail.
NASA data may be unavailable.
Amazon Bedrock may return an error.
A user may upload an invalid image.
A database may temporarily fail.
We therefore designed failure paths rather than assuming everything always works.
For example:
```
Bedrock unavailable
↓
AI analysis fails
↓
Citizen-provided information retained
↓
Risk engine continues
```
Similarly:
```
NASA unavailable
↓
NASA evidence marked unavailable
↓
Citizen evidence continues
↓
Route analysis still works
```
This is especially important for applications where one external data source should not bring down the entire workflow.
***
# 18. Responsible AI
FloodRoute deals with a potentially high-impact situation: travel during flooding.
That means we need to be careful about what the system claims.
We deliberately avoid statements such as:
❌ "This road is safe."
❌ "This road is definitely flooded."
❌ "You can safely travel this route."
Instead, the application communicates evidence:
✅ `LOW_REPORTED_RISK`
✅ `MEDIUM_REPORTED_RISK`
✅ `HIGH_REPORTED_RISK`
And includes the disclaimer:
> **Reported risk is based on available recent reports near the route and does not guarantee current road conditions.**
This is one of the most important parts of our architecture.
The system supports human decision-making rather than pretending that a model can perfectly understand real-world road conditions.
***
# 19. What We Built With AWS
Our AWS architecture uses different services for different responsibilities.
| AWS Service | Role |
| --------------- | ------------------------------------------- |
| Amazon Bedrock | AI-assisted analysis of citizen text/images |
| Amazon S3 | Flood-report image storage |
| Amazon DynamoDB | Structured flood-report persistence |
| AWS IAM | Secure service authorization |
| AWS SDK / boto3 | Backend integration |
External services:
| Service | Role |
| ---------- | ------------------------ |
| NASA VIIRS | Satellite flood evidence |
| Nominatim | Geocoding |
| OSRM | Route generation |
| Vercel | Frontend deployment |
| Render | FastAPI deployment |
The important architectural principle was:
> **Each service has a specific responsibility.**
We didn't introduce AI into components where deterministic logic was more appropriate.
***
# 20. Deployment Architecture
Our deployed architecture looks like:
```
Internet
│
▼
┌───────────────┐
│ Vercel │
│ React Frontend│
└───────┬───────┘
│ HTTPS
▼
┌───────────────┐
│ Render │
│ FastAPI │
└───────┬───────┘
│
┌──────────┼──────────┐
▼ ▼ ▼
Bedrock S3 DynamoDB
│
│
└──────────────┐
▼
Risk Engine
+ NASA VIIRS
```
This allowed us to demonstrate the application through a publicly accessible frontend while keeping the backend API separate.
***
# 21. What We Learned
Building FloodRoute taught us several lessons beyond simply connecting APIs.
### 1. AI shouldn't make every decision
LLMs are excellent for interpreting unstructured information.
They aren't necessarily the right component for deterministic policy decisions.
***
### 2. Freshness matters
A report from five minutes ago and a report from five hours ago should not be treated equally when conditions can change rapidly.
***
### 3. Multiple evidence sources are stronger than a single signal
Citizen reports and satellite data provide different perspectives.
Combining them creates a richer evidence model.
***
### 4. Failure handling is part of the architecture
External APIs fail.
AI services fail.
Data can be missing.
A resilient application needs to continue operating gracefully.
***
### 5. Responsible communication matters
For systems connected to real-world safety, the wording of the output can be just as important as the algorithm.
***
# 22. What's Next?
FloodRoute is currently a prototype, but there are several directions we would explore next.
### Alternative route comparison
Instead of only evaluating one route:
```
Route A → HIGH_REPORTED_RISK
```
the system could evaluate:
```
Route A → HIGH_REPORTED_RISK
Route B → MEDIUM_REPORTED_RISK
Route C → LOW_REPORTED_RISK
```
while still showing distance and travel-time tradeoffs.
### Better geospatial infrastructure
At larger scale, we would move beyond application-side filtering and introduce a more specialized geospatial architecture.
### Historical flood analytics
Historical satellite and citizen reports could help identify recurring flood-prone areas.
### Better report verification
Reports could be cross-checked using:
* multiple nearby reports
* image consistency
* temporal consistency
* satellite observations
### Offline/low-connectivity support
Disaster scenarios often involve unreliable connectivity, making offline or low-bandwidth experiences another important direction.
***
# 23. Try FloodRoute
🌐 **Live Application**
[FloodRoute — Live Demo]()
🔗 **Source Code**
[FloodRoute on GitHub]()
The application is built as a two-person project and was developed with a focus on combining practical cloud engineering, AI-assisted analysis, geospatial processing, and responsible AI design.
***
# 24. Final Takeaway
FloodRoute started with a simple question:
> **"Can we check the flood evidence around our route before travelling?"**
The answer wasn't to build another chatbot.
It was to build a system where different technologies perform the jobs they are actually good at:
```
React
↓
Routing
↓
Citizen reports
↓
Amazon Bedrock
↓
Structured evidence
↓
NASA satellite evidence
↓
Deterministic risk engine
↓
Transparent route-level result
```
The most important lesson from the project is that **AI doesn't have to be the final decision-maker to be valuable**.
Amazon Bedrock helps us transform messy, unstructured citizen information into useful structured evidence.
AWS storage services give that information persistence.
NASA provides an independent satellite-based signal.
And a deterministic engine brings the evidence together in a way that can be tested and explained.
That combination is what makes FloodRoute more than just an AI demo.
It is a prototype for **evidence-aware navigation during uncertain conditions**.
🔗 Source Code
Imagine you're about to travel from one city to another during the monsoon.
Your navigation application gives you a route, estimates the travel time, and tells you when you should arrive.
But there is another question that matters:
> **What flood-related evidence is available along my route right now?**
Traditional navigation systems are primarily optimized for roads, distance, traffic, and travel time. During flooding, however, road conditions can change quickly, and information may come from sources that conventional navigation systems do not incorporate directly.
This led us to build **FloodRoute** — a flood-aware navigation prototype that combines:
* 🧑🤝🧑 Recent citizen flood reports
* 🤖 AI-assisted analysis using **Amazon Bedrock**
* 🛰️ NASA VIIRS satellite flood evidence
* 🗺️ Real route data
* 🗄️ Amazon DynamoDB
* 🪣 Amazon S3
* ⚙️ A deterministic route-risk engine
The important design decision was this:
> **We did not ask an LLM to decide whether a road is safe.**
Instead, AI helps interpret unstructured reports, while the final route-risk classification is produced by a deterministic system using evidence, severity, freshness, and proximity.
***
# 1. The Problem
Flooding creates a difficult information problem.
A user might have:
* a route from Kurnool to Nandyal,
* several citizen reports,
* photographs of flooded roads,
* satellite flood observations,
* and reports of different ages and severities.
But simply collecting this information isn't enough.
We need to answer:
> **Which pieces of evidence are actually relevant to this route?**
For example:
```
Report A
HIGH severity
10 minutes old
80 meters from route
Report B
LOW severity
5 hours old
2.4 km from route
Report C
MEDIUM severity
35 minutes old
120 meters from route
```
These reports should not have equal influence.
A recent high-severity report close to the route is much more relevant than an old report several kilometers away.
That became the foundation of our risk engine.
***
# 2. Our Solution — FloodRoute
FloodRoute allows a user to:
1. Enter an origin.
2. Enter a destination.
3. Generate a real road route.
4. Analyze recent flood reports around that route.
5. Analyze available satellite flood evidence.
6. Combine the evidence.
7. Display route-level reported risk.
The user sees classifications such as:
```
LOW_REPORTED_RISK
MEDIUM_REPORTED_RISK
HIGH_REPORTED_RISK
```
We intentionally use the term **reported risk**.
FloodRoute does **not** claim:
> "This road is definitely flooded."
Instead, it communicates:
> "Available evidence indicates a higher reported level of flood risk around this route."
This distinction is important when building systems that influence real-world decisions.
***
# 3. High-Level Architecture
The system is divided into five major layers.
```
┌──────────────────────┐
│ React App │
│ │
│ Origin → Destination │
│ Route + Risk Map │
└──────────┬───────────┘
│
▼
┌──────────────────────┐
│ FastAPI API │
│ │
│ /reports │
│ /reports/near-route │
│ /flood/analyze-route │
└───────┬───────┬──────┘
│ │
┌─────────────┘ └──────────────┐
▼ ▼
┌─────────────────┐ ┌─────────────────┐
│ Citizen Reports │ │ NASA VIIRS │
│ │ │ Flood Evidence │
└────────┬────────┘ └────────┬────────┘
│ │
▼ │
┌─────────────────┐ │
│ Amazon Bedrock │ │
│ Text + Image AI │ │
└────────┬────────┘ │
│ │
└──────────────┬─────────────────────┘
▼
┌──────────────────────┐
│ Evidence Aggregator │
│ │
│ Deterministic Risk │
│ Engine │
└──────────┬───────────┘
│
▼
┌──────────────────────┐
│ Route Risk Result │
│ │
│ LOW / MEDIUM / HIGH │
└──────────────────────┘
```
The application uses AWS services where they provide a clear architectural benefit rather than adding AWS services simply for the sake of using them.
***
# 4. Why We Used Amazon Bedrock
Citizen reports are not structured data.
A user might submit:
> "Road is completely covered with water and bikes are struggling to pass."
Another user might upload:
> 📷 A photograph showing water covering a road.
A traditional rule-based system would struggle to extract consistent information from this.
We therefore use **Amazon Bedrock** for AI-assisted report analysis.
The AI can help extract structured information such as:
```
{
"condition": "FLOODED",
"severity": "HIGH",
"vehicle_impact": "TWO_WHEELERS_LIKELY_AFFECTED",
"flood_detected": true,
"confidence": 0.87
}
```
This converts an unstructured citizen report into information our application can process.
***
# 5. But We Don't Let the LLM Decide the Final Risk
This was one of our most important architectural decisions.
A tempting design would be:
```
User Route
↓
LLM
↓
"Safe" / "Unsafe"
```
We deliberately avoided that.
Instead:
```
Citizen report
↓
Amazon Bedrock
↓
Structured evidence
↓
Deterministic risk engine
↓
Route risk
```
The AI performs interpretation.
The deterministic engine performs the final calculation.
This gives us:
* reproducibility
* explainability
* easier testing
* predictable behavior
* reduced dependence on model output
It also means that changing the AI model does not automatically change our risk policy.
***
# 6. Making Fresh Reports Matter More
Not every report should have the same weight.
Flood conditions can change rapidly.
Our freshness model therefore reduces the influence of older reports.
We use the following freshness factors:
| Report age | Freshness factor |
| -------------- | ---------------- |
| 0–30 minutes | 1.0 |
| 30–120 minutes | 0.7 |
| 2–6 hours | 0.4 |
| 6+ hours | 0.1 |
This means a report from eight minutes ago can have significantly more influence than a report from several hours ago.
***
# 7. Route Proximity Matters
A flood report doesn't necessarily affect the entire route.
Consider:
```
Report
●
│
│ 2.5 km
│
════════════════════════════
User Route
```
That report should not have the same importance as:
```
● Report
│
│ 80 m
│
════════════════════════════
User Route
```
FloodRoute therefore performs geographic proximity calculations using route coordinates and report coordinates.
Our default route-analysis radius is:
```
100 meters
```
We use the Haversine/geospatial distance between points to determine whether reports are relevant to a route.
***
# 8. Why DynamoDB?
Flood reports are naturally represented as structured documents.
A report contains information such as:
```
{
"report_id": "R001",
"latitude": 15.8281,
"longitude": 78.0373,
"condition": "FLOODED",
"severity": "HIGH",
"description": "Water covering road",
"vehicle_impact": "TWO_WHEELERS_LIKELY_AFFECTED",
"created_at": "2026-09-20T10:15:00Z",
"status": "ACTIVE",
"source": "CITIZEN"
}
```
We use **Amazon DynamoDB** to persist these reports.
The application retrieves active reports and performs route-proximity filtering in the application layer.
For our hackathon-scale workload, this approach keeps the architecture simple while leaving room for a more specialized geospatial architecture at larger scale.
***
# 9. Why Amazon S3?
Citizen reports can contain images.
Instead of storing binary image data directly in DynamoDB, we store images in **Amazon S3**.
Our object structure follows a pattern such as:
```
reports/
R001/
uuid-image.jpg
```
The S3 bucket is intended to remain private.
We also validate:
* file type
* file extension
* content signature
* maximum file size
The application does not expose the bucket publicly.
***
# 10. Adding a Second Evidence Source: NASA
Citizen reports have an important limitation:
> They only represent what people have reported.
We wanted a second source of evidence.
FloodRoute therefore integrates the **NASA VIIRS Global Flood Product**.
The NASA product provides satellite-derived flood evidence at approximately 250-meter resolution.
This gives us a completely different type of signal:
```
Citizen evidence
+
Satellite evidence
↓
Unified evidence
```
This is particularly interesting because the two sources have different strengths.
### Citizen reports
Can provide:
* local observations
* descriptions
* vehicle impact
* photographs
* very recent information
### Satellite evidence
Can provide:
* broader spatial coverage
* independent evidence
* observations even where no citizen has submitted a report
***
# 11. We Had to Be Careful With Satellite Data
Satellite flood products operate at an area scale.
Therefore, we do **not** claim:
> "100% of this road is flooded."
Instead, FloodRoute reports something like:
> **NASA flood evidence overlaps 100% of the tested route.**
That wording is important.
A 250-meter satellite observation does not prove that a specific individual road segment is physically flooded at this exact moment.
It is evidence that must be interpreted appropriately.
***
# 12. Combining Citizen + NASA Evidence
The final system combines two independent evidence streams.
```
Citizen Risk
│
├── Severity
├── Freshness
└── Route proximity
│
▼
Citizen Score
│
│
NASA Evidence ───────► NASA Score
│
▼
Evidence Aggregator
│
▼
Final Route Risk
```
The final risk uses the stronger available evidence rather than allowing one source to silently override the other.
For example:
```
Citizen evidence: MEDIUM
NASA evidence: HIGH
Final: HIGH_REPORTED_RISK
```
Or:
```
Citizen evidence: HIGH
NASA evidence: NONE
Final: HIGH_REPORTED_RISK
```
The entire process is deterministic and testable.
***
# 13. The API That Connects Everything
One of the important endpoints is:
```
POST /reports/near-route
```
The frontend sends route coordinates:
```
{
"route": [
{
"latitude": 15.8281,
"longitude": 78.0373
},
{
"latitude": 15.8285,
"longitude": 78.0381
},
{
"latitude": 15.8290,
"longitude": 78.0390
}
],
"radius_meters": 100
}
```
The backend returns route-level evidence:
```
{
"success": true,
"data": {
"route_risk": "HIGH",
"affected_segments": [
{
"latitude": 15.8285,
"longitude": 78.0381,
"risk": "HIGH",
"reports": 3,
"latest_report_minutes_ago": 8
}
]
}
}
```
This keeps the frontend relatively simple.
The frontend visualizes the result rather than implementing the risk policy itself.
***
# 14. Frontend: Real Routing and Small-Town Support
We wanted FloodRoute to work beyond major metropolitan areas.
The frontend uses:
* React
* Nominatim geocoding
* OSRM routing
* Leaflet-based map visualization
Users can search for locations such as:
```
Kurnool
Nandyal
Adoni
Dhone
Yemmiganur
Guntakal
Allagadda
Banaganapalle
```
We specifically tested small-town and locality searches because a disaster-response application shouldn't assume that users only travel between major cities.
***
# 15. A Small but Important Engineering Problem: Coordinate Formats
One integration issue we encountered was coordinate representation.
Routing APIs can return coordinates as:
```
[longitude, latitude]
```
while our backend contract expects:
```
{
"latitude": 15.8281,
"longitude": 78.0373
}
```
Sending the wrong representation can produce extremely confusing map behavior.
We therefore normalize route coordinates before sending them to the backend.
```
OSRM
↓
[longitude, latitude]
↓
Normalization layer
↓
{ latitude, longitude }
↓
FastAPI
```
This seems small, but integration boundaries like this can cause some of the hardest-to-debug failures in multi-service applications.
***
# 16. Testing the System
We didn't want to rely only on a successful demo.
Our backend test suite covers:
* report creation
* report retrieval
* active reports
* S3 validation
* Bedrock integration behavior
* DynamoDB repository behavior
* route proximity
* freshness weighting
* risk calculation
* NASA integration
* unified evidence aggregation
* NASA failure isolation
Final backend test result:
```
58 passed
```
We also tested actual NASA data retrieval and route analysis.
For example, a test route returned:
```
Route distance: 1.18 km
NASA evidence overlap: 100%
HTTP status: 200
```
Again, this means that NASA flood evidence overlapped the tested route — **not that every meter of the physical road was confirmed flooded.**
***
# 17. Designing for Failure
One of the lessons from this project was that external services will fail.
NASA data may be unavailable.
Amazon Bedrock may return an error.
A user may upload an invalid image.
A database may temporarily fail.
We therefore designed failure paths rather than assuming everything always works.
For example:
```
Bedrock unavailable
↓
AI analysis fails
↓
Citizen-provided information retained
↓
Risk engine continues
```
Similarly:
```
NASA unavailable
↓
NASA evidence marked unavailable
↓
Citizen evidence continues
↓
Route analysis still works
```
This is especially important for applications where one external data source should not bring down the entire workflow.
***
# 18. Responsible AI
FloodRoute deals with a potentially high-impact situation: travel during flooding.
That means we need to be careful about what the system claims.
We deliberately avoid statements such as:
❌ "This road is safe."
❌ "This road is definitely flooded."
❌ "You can safely travel this route."
Instead, the application communicates evidence:
✅ `LOW_REPORTED_RISK`
✅ `MEDIUM_REPORTED_RISK`
✅ `HIGH_REPORTED_RISK`
And includes the disclaimer:
> **Reported risk is based on available recent reports near the route and does not guarantee current road conditions.**
This is one of the most important parts of our architecture.
The system supports human decision-making rather than pretending that a model can perfectly understand real-world road conditions.
***
# 19. What We Built With AWS
Our AWS architecture uses different services for different responsibilities.
| AWS Service | Role |
| --------------- | ------------------------------------------- |
| Amazon Bedrock | AI-assisted analysis of citizen text/images |
| Amazon S3 | Flood-report image storage |
| Amazon DynamoDB | Structured flood-report persistence |
| AWS IAM | Secure service authorization |
| AWS SDK / boto3 | Backend integration |
External services:
| Service | Role |
| ---------- | ------------------------ |
| NASA VIIRS | Satellite flood evidence |
| Nominatim | Geocoding |
| OSRM | Route generation |
| Vercel | Frontend deployment |
| Render | FastAPI deployment |
The important architectural principle was:
> **Each service has a specific responsibility.**
We didn't introduce AI into components where deterministic logic was more appropriate.
***
# 20. Deployment Architecture
Our deployed architecture looks like:
```
Internet
│
▼
┌───────────────┐
│ Vercel │
│ React Frontend│
└───────┬───────┘
│ HTTPS
▼
┌───────────────┐
│ Render │
│ FastAPI │
└───────┬───────┘
│
┌──────────┼──────────┐
▼ ▼ ▼
Bedrock S3 DynamoDB
│
│
└──────────────┐
▼
Risk Engine
+ NASA VIIRS
```
This allowed us to demonstrate the application through a publicly accessible frontend while keeping the backend API separate.
***
# 21. What We Learned
Building FloodRoute taught us several lessons beyond simply connecting APIs.
### 1. AI shouldn't make every decision
LLMs are excellent for interpreting unstructured information.
They aren't necessarily the right component for deterministic policy decisions.
***
### 2. Freshness matters
A report from five minutes ago and a report from five hours ago should not be treated equally when conditions can change rapidly.
***
### 3. Multiple evidence sources are stronger than a single signal
Citizen reports and satellite data provide different perspectives.
Combining them creates a richer evidence model.
***
### 4. Failure handling is part of the architecture
External APIs fail.
AI services fail.
Data can be missing.
A resilient application needs to continue operating gracefully.
***
### 5. Responsible communication matters
For systems connected to real-world safety, the wording of the output can be just as important as the algorithm.
***
# 22. What's Next?
FloodRoute is currently a prototype, but there are several directions we would explore next.
### Alternative route comparison
Instead of only evaluating one route:
```
Route A → HIGH_REPORTED_RISK
```
the system could evaluate:
```
Route A → HIGH_REPORTED_RISK
Route B → MEDIUM_REPORTED_RISK
Route C → LOW_REPORTED_RISK
```
while still showing distance and travel-time tradeoffs.
### Better geospatial infrastructure
At larger scale, we would move beyond application-side filtering and introduce a more specialized geospatial architecture.
### Historical flood analytics
Historical satellite and citizen reports could help identify recurring flood-prone areas.
### Better report verification
Reports could be cross-checked using:
* multiple nearby reports
* image consistency
* temporal consistency
* satellite observations
### Offline/low-connectivity support
Disaster scenarios often involve unreliable connectivity, making offline or low-bandwidth experiences another important direction.
***
# 23. Try FloodRoute
🌐 **Live Application**
[FloodRoute — Live Demo]()
🔗 **Source Code**
[FloodRoute on GitHub]()
The application is built as a two-person project and was developed with a focus on combining practical cloud engineering, AI-assisted analysis, geospatial processing, and responsible AI design.
***
# 24. Final Takeaway
FloodRoute started with a simple question:
> **"Can we check the flood evidence around our route before travelling?"**
The answer wasn't to build another chatbot.
It was to build a system where different technologies perform the jobs they are actually good at:
```
React
↓
Routing
↓
Citizen reports
↓
Amazon Bedrock
↓
Structured evidence
↓
NASA satellite evidence
↓
Deterministic risk engine
↓
Transparent route-level result
```
The most important lesson from the project is that **AI doesn't have to be the final decision-maker to be valuable**.
Amazon Bedrock helps us transform messy, unstructured citizen information into useful structured evidence.
AWS storage services give that information persistence.
NASA provides an independent satellite-based signal.
And a deterministic engine brings the evidence together in a way that can be tested and explained.
That combination is what makes FloodRoute more than just an AI demo.
It is a prototype for **evidence-aware navigation during uncertain conditions**.
The application is built as a two-person project and was developed with a focus on combining practical cloud engineering, AI-assisted analysis, geospatial processing, and responsible AI design.
24. Final Takeaway
FloodRoute started with a simple question:
"Can we check the flood evidence around our route before travelling?"
The answer wasn't to build another chatbot.
It was to build a system where different technologies perform the jobs they are actually good at:
1
2
3
4
5
6
7
8
9
10
11
12
13
14
15
React
  ↓
Routing
  ↓
Citizen reports
  ↓
Amazon Bedrock
  ↓
Structured evidence
  ↓
NASA satellite evidence
  ↓
Deterministic risk engine
  ↓
Transparent route-level result
The most important lesson from the project is that AI doesn't have to be the final decision-maker to be valuable.
Amazon Bedrock helps us transform messy, unstructured citizen information into useful structured evidence.
AWS storage services give that information persistence.
NASA provides an independent satellite-based signal.
And a deterministic engine brings the evidence together in a way that can be tested and explained.
That combination is what makes FloodRoute more than just an AI demo.
It is a prototype for evidence-aware navigation during uncertain conditions.
Enjoyed reading this content? Let the author know!
Your likes, comments, shares, and saves help creators reach more builders.

Loading recommendations
Loading article