
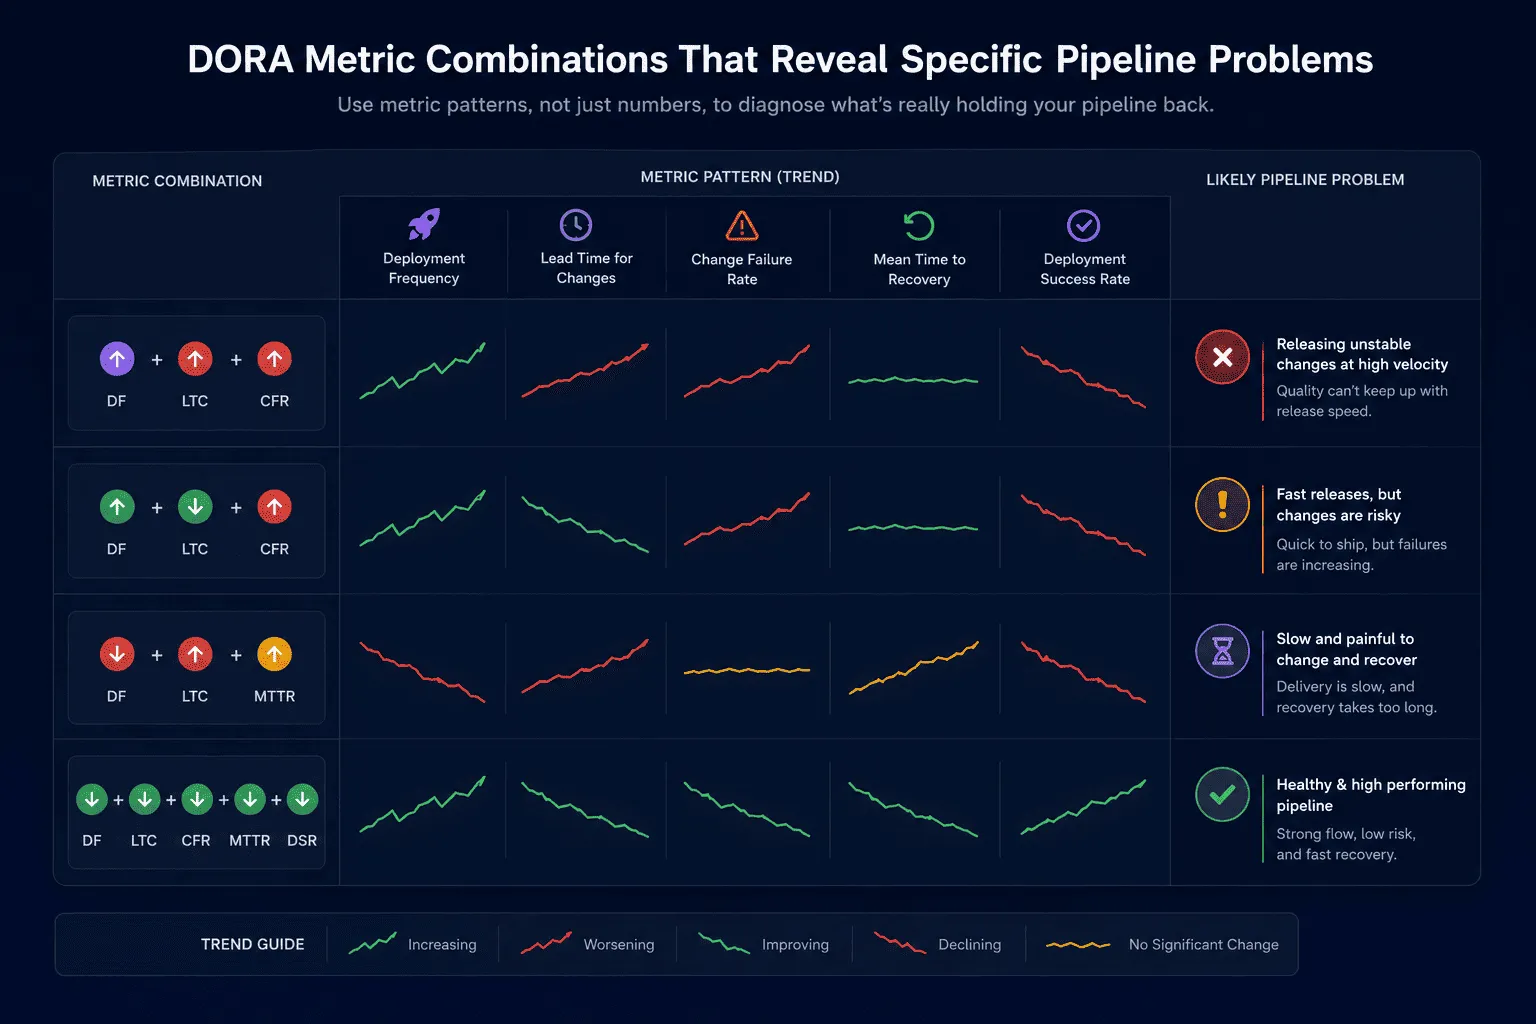
The DORA Metric Combinations That Reveal Specific Pipeline Problems
DORA metrics mean little when read in isolation. Understand the specific combinations across all five metrics that reveal exactly where a delivery pipeline is under stress and what to fix.

Deployment frequency of three times a week means almost nothing on its own.
It could describe a team in excellent shape- shipping small, well-validated changes with fast recovery if anything goes wrong. It could just as easily describe a team in real trouble, shipping just often enough to accumulate risk without the validation or recovery infrastructure to handle it when something breaks. The number alone cannot distinguish between these two situations. Only the other four numbers can.
This is the part of DORA metrics that gets lost when teams track them as five separate dashboard widgets, glanced at individually rather than read against each other. The diagnostic value of the framework lives almost entirely in the combinations- in what one metric looks like when read alongside another. Specific patterns across these five numbers point to specific, identifiable problems with specific fixes. Reading them this way is what turns DORA metrics from a reporting exercise into an actual diagnostic tool.
The Five Metrics, Briefly
Before getting into combinations, the five DORA metrics worth being precise about: deployment frequency measures how often code reaches production. Lead time for changes measures how long code takes to get from commit to production. Change failure rate measures what percentage of deployments cause a problem requiring remediation. Mean time to recovery measures how long it takes to restore service after an incident. Reliability- the fifth metric added in the most recent framework revision- measures whether the system maintains its stability and performance targets consistently over time as change continues.
Each metric in isolation answers a narrow question. Read together, they answer a much more useful one: where specifically is this delivery system under stress, and what kind of stress is it?
Combination One: High Deployment Frequency With High Change Failure Rate
When a team deploys often but breaks things often, the instinct is usually to slow down. This instinct is almost always wrong, and the reason is worth understanding rather than just accepting.
A high change failure rate alongside high deployment frequency typically means the validation infrastructure has not kept pace with deployment cadence. The team scaled how often they ship without scaling how thoroughly they verify what they are shipping. This is a coverage problem, not a speed problem.
The fix that actually works is almost never reducing deployment frequency. Reducing frequency increases batch size per deployment, which increases the surface area of each individual release, which tends to push change failure rate higher rather than lower. The fix that moves this combination in the right direction is closing the validation gap specifically, checking whether the test coverage running before each deployment reflects current system behavior or stale assumptions about how dependent services respond. In distributed systems, this is often where the actual gap lives: integration test coverage that looked comprehensive when it was written and has quietly drifted from what services now actually do.
Combination Two: Short Lead Time With High Mean Time to Recovery
This pairing describes a team that ships fast and recovers slowly- speed without resilience.
Short lead time means the path from commit to production is efficient. Code moves through review, testing, and deployment without significant friction. This is genuinely good. The problem surfaces when something goes wrong, because the same team that built an efficient forward path often has not built an equally efficient path for detecting and reversing problems.
This combination usually points to an investment gap in observability and incident response rather than in deployment tooling. The team has optimized for the happy path- getting working code to production quickly, and underinvested in the unhappy path- knowing quickly when something is not working and having a fast, practiced way to address it. The fix is rarely about deployment speed. It is about closing the gap between when an incident starts and when someone with the ability to act on it actually knows about it, and then closing the gap between knowing and resolving.
Combination Three: Healthy First Four Metrics With Declining Reliability
This is the combination that catches experienced engineering leaders off guard, because it does not show up as an obvious red flag in any single number.
Deployment frequency looks fine. Lead time looks fine. Change failure rate is within acceptable range. Mean time to recovery is reasonable. And yet reliability- the system's actual stability and performance consistency over time, is trending downward.
What this combination usually reveals is that the pace of change, in aggregate, has started exceeding what the underlying testing, validation, and monitoring infrastructure can absorb safely, even though no single deployment is obviously responsible. Each individual change passes its gates. The cumulative effect of many individually-acceptable changes is a system under more stress than any one metric captures. This is the systemic version of a problem that looks fine at the level of any single observation and only becomes visible in aggregate.
The fix here requires looking past the deployment-by-deployment view entirely. It usually means investing in the infrastructure underneath all five metrics- the testing approach, the observability depth, the deployment architecture, rather than addressing any single deployment that triggered an incident. This is also where the question of how test coverage stays accurate as a system evolves becomes most relevant. A team whose coverage is grounded in what services currently do, rather than in specifications written when those services first launched, has a structural advantage in keeping reliability stable as deployment volume grows.
Combination Four: Low Deployment Frequency With Low Change Failure Rate
This combination is worth including because it is often mistaken for success when it actually represents a different kind of risk.
A team deploying once a month with a near-zero change failure rate looks disciplined on paper. What this combination frequently masks is large batch size per release, and large batches carry risk that a low historical failure rate does not capture. The next deployment, whenever it happens, bundles a substantial amount of change. If something does go wrong, isolating the cause within a large batch takes considerably longer than isolating it within a small one.
This combination is not necessarily broken. Some systems genuinely warrant infrequent, carefully validated releases- certain regulated environments, for instance. But for most teams, this pattern represents an opportunity rather than a stable equilibrium worth preserving. The path forward is gradually decreasing batch size and increasing frequency while watching change failure rate closely, rather than treating the current low failure rate as evidence that nothing needs to change.
Reading the Combinations as a Diagnostic Practice
The shared thread across these four combinations is that DORA metrics function less like a scorecard and more like a set of vital signs that need to be read together to mean anything diagnostically useful. A single elevated number prompts a question. A specific combination of numbers points toward a specific answer.
Building the habit of reading them this way- checking what each metric looks like against the others rather than checking each one against its own historical trend in isolation- is what separates teams that use DORA metrics to genuinely improve their delivery system from teams that track DORA metrics because someone told them they should.
None of the five numbers individually tells the whole story. The relationships between them do. That distinction is the entire value of the framework.
Enjoyed reading this content? Let the author know!
Your likes, comments, shares, and saves help creators reach more builders.

Loading recommendations
Loading article