
Building an AI-Augmented Cloud Monitoring Stack: From 25-Minute MTTD to 5 Minutes with Terraform, Prometheus, and Splunk MLTK
A production-grade observability stack on AWS combining Terraform IaC, Prometheus, Grafana, and Splunk MLTK, reducing mean time to detection from 25 minutes of manual log review to 5 minutes of automated alerting. This article covers the architecture decisions, ML anomaly detection integration, and incident simulations behind a fully reproducible, version-controlled monitoring pipeline.

Why I built this
Most monitoring setups I've encountered in production environments share the same failure pattern: metrics live in one tool, logs live in another, nobody correlates them in real time, and incident detection still depends on someone noticing a problem manually. The tooling exists to fix this. What's rare is seeing it operationalized end to end, as code, with the ML layer treated as a first-class part of the detection pipeline rather than a postprocessing afterthought.
I built this stack to close that gap, and to prove the architecture decisions with real numbers rather than a diagram.
Architecture
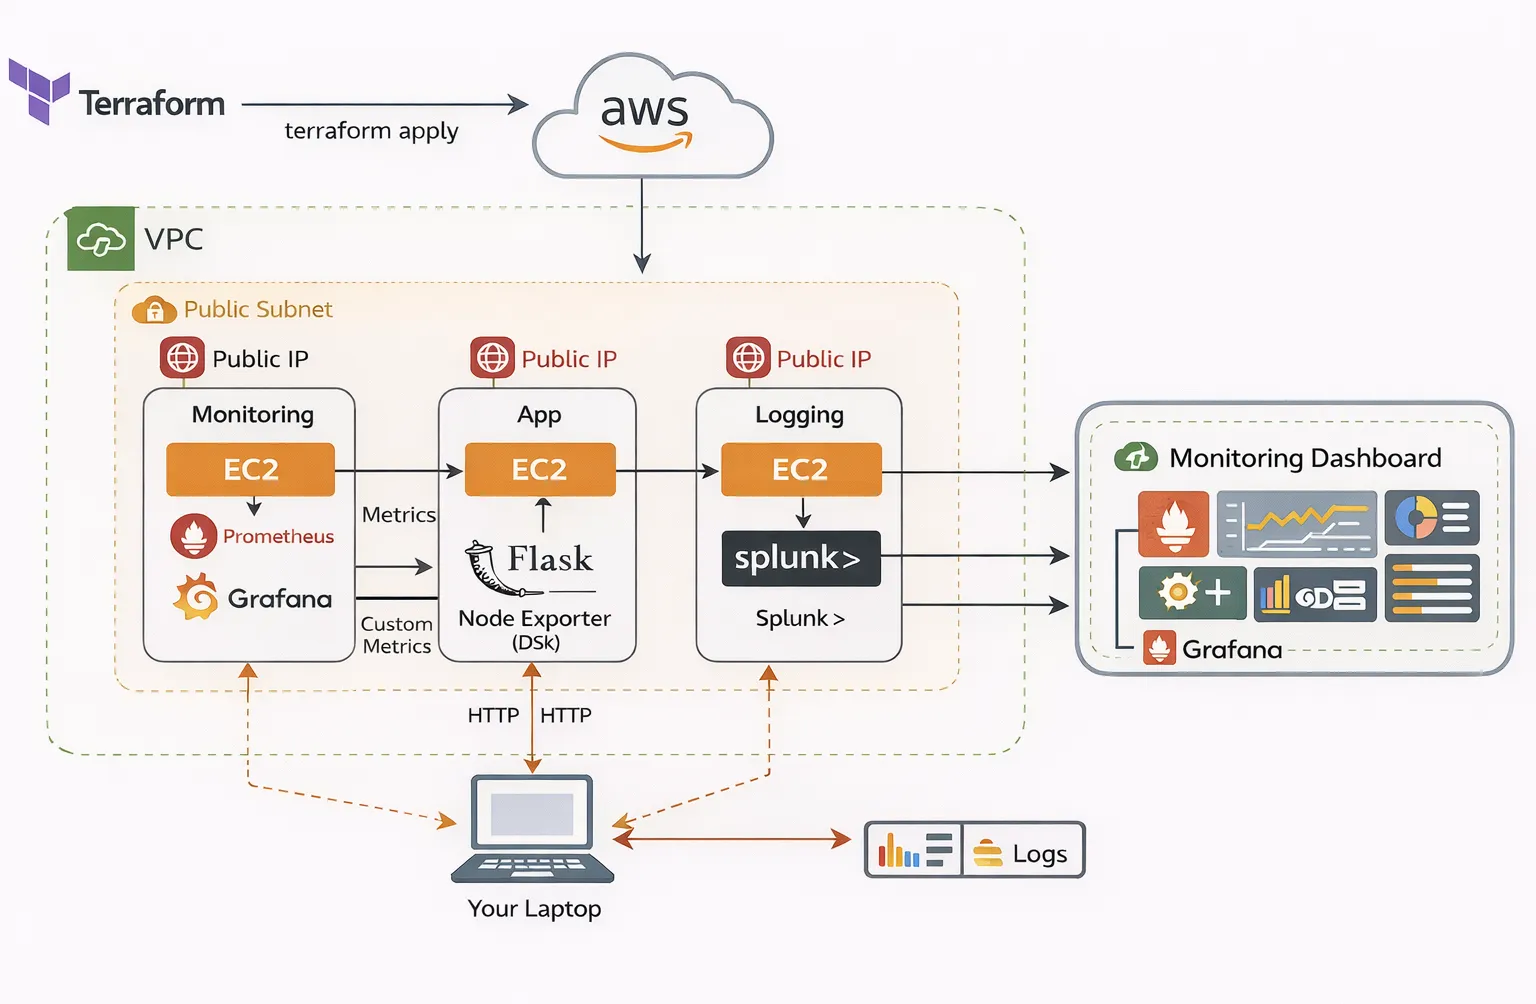
Three EC2 instances, provisioned entirely through Terraform inside a custom VPC:
Server | Type | Role | Private IP |
|---|---|---|---|
Monitoring | t3.small | Prometheus + Grafana + Node Exporter | 10.0.1.106 |
Splunk | t3.medium | Splunk Enterprise + MLTK | 10.0.1.61 |
App | t3.micro | Flask API + Node Exporter + Splunk Forwarder | 10.0.1.181 |

Design constraints I held to throughout:
- Public subnet with an Internet Gateway, but SSH locked to a single engineer IP (/32) — no
0.0.0.0/0anywhere
- Prometheus scrapes targets over private VPC IPs, never public
- Node Exporter (port 9100) reachable only from within the VPC CIDR
- Zero hardcoded credentials;
terraform.tfvarsand.pemfiles excluded from version control via.gitignore
The Metrics Layer
Prometheus scrapes all nodes every 15 seconds via Node Exporter and a custom
/metrics endpoint instrumented into the Flask API. Four Grafana panels carry the application observability story:rate(app_requests_total[5m]) # Request Rate
rate(app_errors_total[5m]) # Error Rate
histogram_quantile(0.95, rate(app_request_latency_seconds_bucket[5m])) # P95 Latency
100 - (avg(irate(node_cpu_seconds_total{mode="idle"}[5m])) * 100) # CPU %I deliberately weighted the dashboard toward application signals over infrastructure signals. CPU and memory graphs are table stakes; request rate, error rate, and P95 latency are what tell you whether the service is healthy, which is the question that actually matters during an incident.
Alert rules fire to Slack on two conditions: CPU above 80% sustained for 2 minutes, and error rate above 1/sec sustained for 1 minute. During a stress test (
stress --cpu 2 --timeout 120 ), the stack detected a CPU spike to 50.3%, fired a Slack alert within 3 minutes, and auto-resolved when load dropped, no manual intervention at any point in that loop.The Log and Anomaly Detection Layer
This is the piece that moves the stack from "monitoring" to "AI-augmented observability."
A Splunk Universal Forwarder ships Flask application logs and Linux audit logs from the app server to Splunk Enterprise over port 9997 on the private VPC network. The Splunk Machine Learning Toolkit trains a DensityFunction model on request volume patterns to establish a baseline of normal traffic. Anything outside the 95th percentile gets flagged as an anomaly and surfaced in the Splunk Security Dashboard.
This catches categories of problems that static thresholds miss by construction: traffic volume anomalies that don't breach a fixed error-rate threshold, off-hours access patterns, and subtle drift in system audit events (BPF program load/unload activity, for instance). It's the same density-estimation approach used in production AIOps pipelines specifically to cut alert fatigue while still catching the signals that matter.
I validated this with four incident simulations: a CPU stress test, a synthetic error-rate spike (
for i in {1..50}; do curl ... ; done against an endpoint with a 10% random error rate), a deliberate service-down event ( systemctl stop flask-app , confirmed Prometheus fired InstanceDown within a minute and auto-resolved on restart), and a failed-auth event captured by the Linux audit log and visible in the Splunk dashboard within seconds.The result that matters
Metric | Before | After |
|---|---|---|
Mean Time to Detection | 25 min (manual log review) | 5 min (automated) |
CPU spike detection | Manual CloudWatch check | Real-time Slack alert |
Anomaly detection | None | Splunk MLTK density model |
Infrastructure provisioning | Manual console clicks | Terraform, 3 servers in 3 minutes |
A 5x reduction in MTTD is the number I would put in front of any engineering leader evaluating this. Everything else in the stack exists in service of that number.
What I'd build next
The current stack is solid but I'm treating it as v1. The roadmap I'm working against: HashiCorp Vault for dynamic credentials, EKS cluster monitoring with kube-state-metrics for pod-level observability, PagerDuty for escalation policies, Terraform remote state with S3 + DynamoDB locking, GuardDuty integrated into the Splunk SIEM pipeline, and GitHub Actions to validate
terraform plan on every PR.Try it yourself
The full Terraform configuration, Flask app, Prometheus rules, and setup walkthrough are on GitHub: https://github.com/Wiryenkfea-Eric/ai-monitoring-stack.  ;
Spin-up is three EC2 instances in roughly three minutes; teardown and cost optimization (stop instances, EBS persists state) gets you to about $7/month idle versus $61/month running.
If you're working on similar observability problems or have feedback on the MLTK integration, I'd like to hear it.
Enjoyed reading this content? Let the author know!
Your likes, comments, shares, and saves help creators reach more builders.

Loading recommendations
Loading article