
FuegoRadar: How an Environmental Tragedy Led Me to Build a Serverless Wildfire Monitoring Platform for Argentina
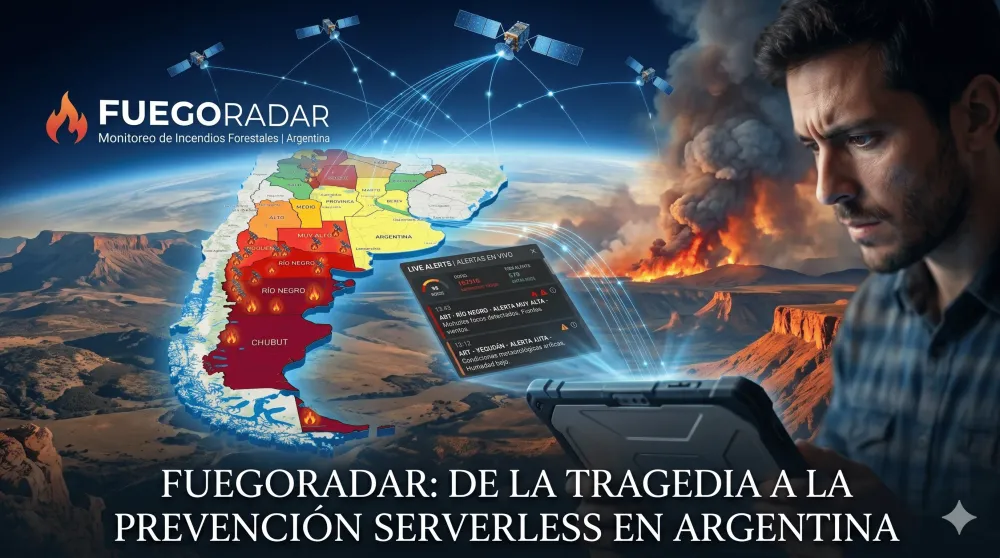
A personal project born from watching wildfire devastation affect Argentine families — not for a grade, not for a competition. FuegoRadar is a fully serverless AWS platform that ingests NASA FIRMS satellite data every 15 minutes, calculates an 8-factor fire risk index across 24 provinces, and delivers real-time alerts when danger turns critical.

THE MOMENT THAT CHANGED EVERYTHING
Last Thursday, on my way home from work on the bus, I found myself watching videos of wildfires spreading across different regions of Argentina. One story hit me particularly hard: families had lost a large part of everything they owned. Rural farmers watched years of work disappear in a matter of hours. Small family businesses were left practically destroyed because the fire spread faster than anyone could contain it.
That's when a question came to me that I couldn't shake:
Isn't there a way to detect these risks earlier — or at least help the people responsible for responding have better information to act faster?
That question was the origin of FuegoRadar. I want to be clear: I didn't build this for an academic requirement, a competition, or a resume line. I built it because I saw a real problem affecting real people, and I had the tools to do something about it.
The Real Problem
During the 2026 austral summer, Argentine Patagonia experienced one of its most destructive wildfire seasons in decades. More than 60,000 hectares were affected in Chubut province alone. Thousands of people were evacuated. Entire ecosystems were damaged in ways that take years to recover.
The hardest part to accept: the data already existed.
- NASA publishes satellite heat detection data every few minutes.
- Argentina's National Meteorological Service publishes real-time climate conditions.
- INDEC offers open provincial geospatial data.
The problem wasn't missing data. The problem was that all of it lived scattered across different agencies, in different formats, designed for technical audiences. For someone who needs to make a quick decision — a rural farmer, a volunteer firefighter, a local official — there was no single place to look and understand the full picture in seconds.
That was the problem I decided to solve.
Why Existing Tools Weren't Enough
NASA FIRMS is remarkable: near real-time VIIRS and MODIS satellite detections with global coverage. But it's designed for analysts with geospatial data experience. It doesn't contextualize information for Argentina. It doesn't combine satellite detections with local weather. It doesn't calculate an integrated risk index or generate alerts.
My goal was never to compete with NASA FIRMS or official agencies. It was to build an interpretation layer on top of those sources — one that transforms raw data into actionable information, accessible to anyone.
What I Built
FuegoRadar is a serverless wildfire monitoring platform for Argentina. It:
- Ingests satellite data from NASA FIRMS every 15 minutes
- Combines it with real-time meteorological data
- Calculates a fire risk index per province and geographic zone
- Generates automatic alerts when risk exceeds critical thresholds
- Serves all of that to an interactive frontend via a cached REST API
The system covers all 24 Argentine jurisdictions (23 provinces + CABA) and handles up to 3,500 active geographic grid zones simultaneously.
Technical Architecture
The entire backend runs on AWS CDK as infrastructure as code, fully serverless. No servers running 24/7. Every component activates on demand or on schedule, keeping costs within the AWS Free Tier at national scale.
The Ingestion Pipeline — Every 15 Minutes
An EventBridge Scheduler triggers an ingestion Lambda (256 MB, 30s timeout) that executes the following pipeline:
- Queries the NASA FIRMS API with Argentina's bounding box (-73.6°, -56.0°, -53.5°, -21.8°) with a 6-second timeout.
- Persists the raw CSV to S3 as firms_raw_{timestamp}.csv for audit purposes.
- Normalizes each detection: latitude, longitude, brightness (bright_ti4 in Kelvin), ISO date, satellite (VIIRS or MODIS), and converts textual confidence to numeric (high=95, nominal=70, low=30).
- Geocodes each point to its Argentine province using ray-casting over GeoJSON polygons. Points outside national territory are discarded.
- Deduplicates detections: if two hotspots are within 0.015° of each other, less than 30 minutes apart, and from the same satellite, only the one with higher confidence is kept.
- Persists hotspots to DynamoDB with a 48-hour TTL.
Fault tolerance: If NASA FIRMS fails (HTTP error, timeout, empty or corrupt CSV), the system preserves existing DynamoDB data without clearing the table and logs the failure type to CloudWatch. After 3 consecutive failures, it triggers an alarm and notifies operators via SNS within 60 seconds.
The Risk Engine — Every 30 Minutes
A second scheduler triggers the calculation Lambda (256 MB, 30s timeout) to compute a composite risk index for each active province.
The core of the engine is a simplified Fire Weather Index (FWI):
1
2
3
4
5
FWI = clamp(0, 100, round(
  temperature × 1.0 +
  (100 − humidity) × 0.5 +
  wind × 0.4
))
On top of the FWI, the engine calculates a riskScore integrating 8 weighted factors starting from a baseline of 25 points:
| Factor | Max Impact | Direction / Notes |
|---|---|---|
| Temperature | ±20 pts | Increases with extreme heat |
| Relative humidity | ±30 pts | Decreases with high humidity |
| Wind speed | +20 pts | Always additive |
| Precipitation >10mm/24h | −30 pts | Significant suppression factor |
| Recent active hotspots | +25 pts | min(25, count × 8) |
| Historical fire record | +10 pts | Zones with prior incidents |
| Active prior critical alert | +15 pts | If an alert is already in place |
| Regional factor | +5 pts | Centro: humidity <20% · Patagonia: wind >25 km/h |
The resulting score is clamped to [0, 100] and classified into five danger levels: Low, Medium, High, Very High, and Extreme.
The engine also estimates the affected area in hectares for each hotspot:
1
2
3
4
5
area = max(1, round(
  (brightness − 300) × 2.2 +
  windSpeed × 1.8 +
  fwi × 0.8
))
When brightness ≤ 300K, the thermal contribution is zero. The minimum guaranteed area is 1 ha.
Every calculation carries a Confidence Score ([50, 100]) that starts at 95 and is penalized for extreme climate deviations from the province's historical baseline, or when the weather API was unavailable and the last valid reading was used instead. This gives users visibility into how much they can trust the number they're looking at.
Data Model — DynamoDB Single Table Design
All entities share a single table (
FireRiskEngine) in On-Demand mode, with two GSIs to support the different access patterns:| Entity | PK | SK | TTL |
|---|---|---|---|
| Hotspot | HOTSPOT#{province} | TS#{date}#{id} | 48 hours |
| Risk Score | RISK#CURRENT | PROVINCE#{name} | — (overwritten each cycle) |
| Risk Zone | ZONE#{id} | PROVINCE#{province} | 2 hours |
| Alert | ALERT#{province} | TS#{date}#{alertId} | 7 days |
| Subscription | SUB#{email} | PROVINCE#{province} | — |
| Ingestion metadata | META#INGESTION | RUN#{timestamp} | — |
Every write goes through strict validation before reaching DynamoDB: riskScore ∈ [0,100], confidenceScore ∈ [50,100], province within the 24 valid jurisdictions, coordinates within the Argentine bounding box. Items that fail validation are discarded without affecting the rest of the batch.
The API and Cache Layer
A query Lambda (128 MB, 10s timeout, read-only) exposes six REST endpoints via API Gateway, fronted by CloudFront:
| Endpoint | Description | Cache TTL | P95 Latency |
|---|---|---|---|
| GET /risk/provinces | All 24 provinces with riskScore, riskLevel, trend, hotspotsCount, confidenceScore | 120s | <500ms |
| GET /risk/zones | Up to 3,500 grid cells with FWI and risk level | 120s | <800ms |
| GET /hotspots | Active hotspots (48h) with coordinates, brightness, satellite, estimated area | 60s | — |
| GET /alerts | Active alerts by province and severity | 60s | — |
| POST /subscriptions | Email alert subscription with 72h verification window | — | — |
| GET /health | System status | — | — |
All endpoints require authentication via
x-api-key header. Rate limiting: 50 req/s sustained, 100 req/s burst — beyond that, HTTP 429 with Retry-After header.The Notification System
The notification Lambda is triggered via SNS whenever an alert with severity ≥ High is generated. It queries verified subscriptions in DynamoDB filtering by province and each subscriber's configured minimum severity, then sends emails via Amazon SES. If SES fails, it retries 3 times with exponential backoff (1s → 2s → 4s) before logging the failure and continuing with remaining subscribers without blocking delivery.
Security and Observability
Each Lambda has a dedicated IAM role with strict least privilege: only the exact permissions it needs, scoped to the specific ARNs of each resource. The query Lambda cannot write to DynamoDB. The ingestion Lambda cannot publish to SNS. No component can do what isn't its responsibility.
- Logs retained for 7 days in CloudWatch. No log entry can contain API keys, subscriber emails, or personal coordinates — masking is applied before emitting any entry with sensitive fields.
- Sensitive configuration (NASA FIRMS API keys, weather API credentials, frontend domain for CORS) lives in AWS Systems Manager Parameter Store, never hardcoded in source code.
The Frontend
The interface is built with React + TypeScript + Vite, using Tailwind CSS and Shadcn UI for components and Leaflet for the interactive map. It deploys as a static site to S3, distributed globally via CloudFront.
What Didn't Go Well (And What I Learned)
The first version was too focused on displaying technical data and not enough on the user who needs to make a decision in seconds. Risk levels weren't visually clear. Map navigation was confusing. Mobile performance was poor.
I had to step back and rethink the interface from the perspective of who uses it, not who built it. That gave me the most important lesson from this project:
Understanding the problem deeply is always harder than solving the technical problem. The stack was relatively straightforward. Making it genuinely useful was the hard part.
Two other lessons worth sharing:
- AWS serverless makes zero-budget production infrastructure real. Everything described above runs within the Free Tier at national scale.
- AI accelerates development but doesn't replace judgment. Kiro significantly accelerated CDK architecture design and integration debugging. But the decisions about what to build, how to model the data, and what to prioritize were always mine. AI is an acceleration tool, not a substitute for technical thinking.
AWS Services Used
| Service | Role in the system |
|---|---|
| AWS CDK | Infrastructure as Code — entire stack defined in TypeScript |
| AWS Lambda | Ingestion, risk engine, query, and notification functions |
| Amazon EventBridge Scheduler | 15-min and 30-min pipeline triggers |
| Amazon DynamoDB | Single-table design for all entities (On-Demand) |
| Amazon S3 | Raw CSV audit storage + static frontend hosting |
| Amazon API Gateway | REST API with API key auth and rate limiting |
| Amazon CloudFront | CDN caching for API responses + frontend distribution |
| Amazon SNS | Alert event fan-out between risk engine and notifier |
| Amazon SES | Transactional email delivery to subscribers |
| AWS Systems Manager (SSM) | Secure parameter storage for secrets and config |
| Amazon CloudWatch | Logs, alarms, and operational observability |
| AWS IAM | Least-privilege per-Lambda roles |
What's Next
There's still a lot left to build:
- Real-time push alerts (WebSocket or push notifications)
- ML-based fire spread prediction trained on Argentine historical data
- Finer meteorological granularity per geographic zone
- Integration with provincial civil defense agencies
But this first version demonstrates that when the problem is worth solving, the technology available today is enough to build something real — and make it available to anyone who needs it.
Conclusion
FuegoRadar started from a simple question I asked myself while watching a tragedy unfold for Argentine families. What began as a personal concern became a platform that ingests satellite data every 15 minutes, calculates fire risk using 8 weighted factors, geocodes detections across 24 jurisdictions, and notifies subscribers when danger turns critical — all running serverless on AWS at near-zero operational cost.
I hope FuegoRadar keeps growing and contributes, even in a small way, to improving how Argentina understands and responds to its wildfires.

Misael — AWS Student Builder Leader Group, UCASAL · Salta, Argentina
Enjoyed reading this content? Let the author know!
Your likes, comments, shares, and saves help creators reach more builders.

Loading recommendations
Loading article