
Building a Self-Healing Observability Agent on AWS EKS: A Hands-On Guide with Prometheus, Claude, and Slack
A hands-on guide to building an autonomous incident-remediation agent on Amazon EKS. Wire Prometheus, Claude, and Slack into a closed loop that detects anomalies, diagnoses root cause, restarts or scales the affected service, and logs every decision - with full code and manifests.

It is 2:47 AM. A PagerDuty notification cuts through the silence: HTTP 5XX rate elevated on the order service. The engineer reaches for their laptop, pulls up Grafana, and begins the familiar ritual of scanning dashboards, cross-referencing logs, forming a theory, testing it, and restarting a pod. By 3:15 AM, the problem is gone, and the engineer is back in bed, none the wiser about what actually caused it.
This is the lived reality of an on-call engineer in a microservices world.
The tooling isn't broken; Prometheus, Grafana, and AlertManager are excellent at what they do. But what they do is collect and visualize signals. Interpreting those signals, reasoning about the root cause, and deciding what to do still falls entirely on the engineer at an inconvenient hour.
So I built an agent on a different premise: what if the system that detects an anomaly could also diagnose it, decide on a remediation, act on it, and deliver a complete incident report before anyone's phone rings?
This walkthrough shows exactly how it's built, deployed on Amazon EKS - Prometheus, Claude, EKS, and Slack, wired into a closed loop so you can follow the same pattern in your own AWS environment. The application code is identical to a vanilla Kubernetes build; what changes is the platform layer around the cluster, and those changes are called out explicitly throughout.
Why EKS Specifically?
EKS is just managed Kubernetes, so the agent's logic, the PromQL, the Claude prompt, and the remediation code do not change at all. What changes is everything around the cluster: how images are stored and pulled (ECR), how the agent authenticates to AWS (IRSA or EKS Pod Identity), how the public entry point is exposed (AWS Load Balancer Controller), where state lives (RDS or EBS-backed volumes), and how the cluster grows when the agent scales out (Karpenter). The rest of this document keeps the original architecture intact and layers the AWS specifics on top.
EKS is just managed Kubernetes, so the agent's logic, the PromQL, the Claude prompt, and the remediation code do not change at all. What changes is everything around the cluster: how images are stored and pulled (ECR), how the agent authenticates to AWS (IRSA or EKS Pod Identity), how the public entry point is exposed (AWS Load Balancer Controller), where state lives (RDS or EBS-backed volumes), and how the cluster grows when the agent scales out (Karpenter). The rest of this document keeps the original architecture intact and layers the AWS specifics on top.
Step 0: Provision the EKS Cluster
Before anything runs, you need a cluster. The fastest path is eksctl, which provisions the VPC, subnets, and a managed node group in one command. Save this as cluster.yaml:
1
2
3
4
5
6
7
8
9
10
11
12
13
14
15
16
17
18
19
20
21
22
23
24
25
26
27
28
29
30
31
32
33
34
35
36
37
apiVersion: eksctl.io/v1alpha5


kind: ClusterConfig


metadata:


  name: pulseshield


  region: us-east-1


  version: "1.30"


iam:


  withOIDC: true            # required for IRSA


managedNodeGroups:


  - name: workers


    instanceType: m5.large


    minSize: 2


    desiredCapacity: 3


    maxSize: 6


addons:


  - name: vpc-cni


  - name: coredns


  - name: kube-proxy


  - name: aws-ebs-csi-driver  # needed only if Postgres runs in-cluster
Then:
1
2
3
eksctl create cluster -f cluster.yaml

aws eks update-kubeconfig --name pulseshield --region us-east-1

kubectl create namespace pulseshield
The
withOIDC: true line is important it provisions the OIDC provider that IRSA depends on in Step 7. Everything from here uses the pulseshield namespace, exactly as in the original.Step 1: Map the System You're Protecting
Before the agent can heal anything, you have to know what it's watching, so the first step is to map the services you want it to cover.
The stack below is a representative e-commerce backend of five services running on the EKS managed node group. It isn't a template you have to copy; your own system will have different services, languages, and ports.
- Nginx API Gateway - the single public entry point (exposed via an AWS load balancer on EKS; see Step 8.5)
- Order Service (Node.js) - order creation and retrieval against PostgreSQL
- Inventory Service (Python/FastAPI) - real-time stock levels
- Notify Service (Node.js) - outbound Slack and email
- AI Agent Service (Python) - the fifth service, the one that watches the other four

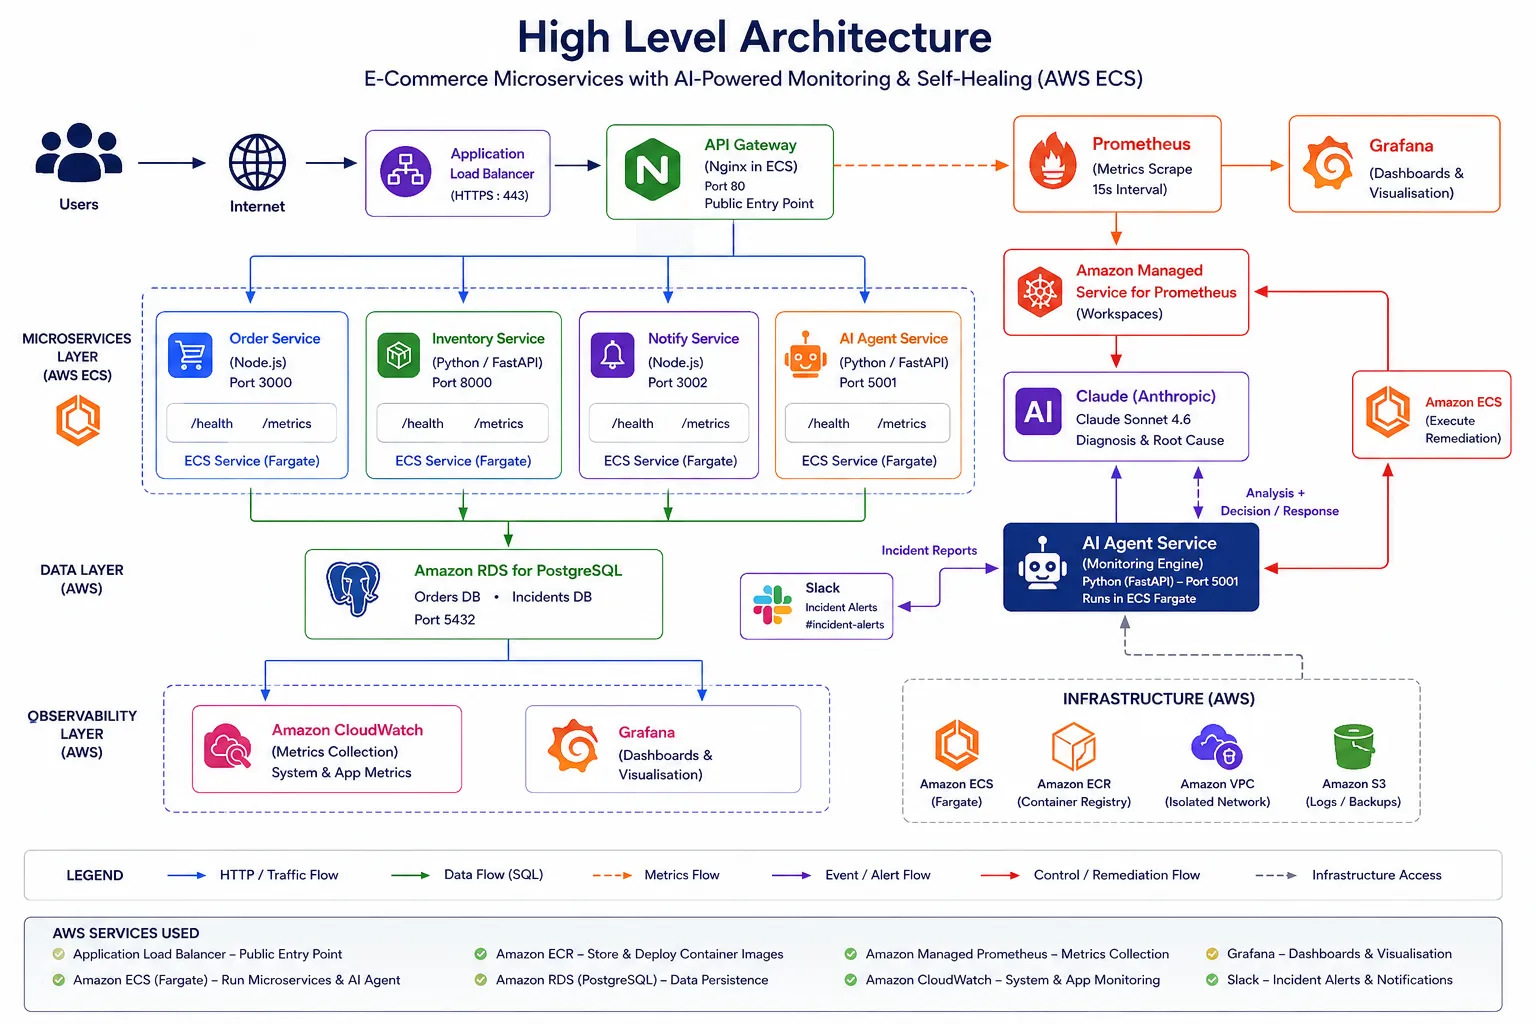
Figure 1: High-level architecture of the closed-loop self-healing system. (Note: this diagram still depicts a local Minikube cluster and a generic Kubernetes API; on EKS the infrastructure box would be Amazon EKS with ECR, RDS, and an AWS load balancer.)
User traffic enters through the Nginx gateway and is routed to four application services, each exposing
/health and /metrics endpoints. Prometheus collects these metrics every 15 seconds, and Grafana provides visualization. The self-healing loop runs on the right: the AI Agent Service executes a 60-second monitoring cycle, querying Prometheus, forwarding anomalies to Claude (Sonnet 4.6) for diagnosis, and, when necessary, invoking the Kubernetes API exposed by EKS to restart or scale the affected service. Each cycle generates an incident report that is sent to Slack and records an entry in the PostgreSQL incidents database.The mix of Node.js and Python is deliberate: most real teams are polyglot by necessity, not design. Services talk over Kubernetes DNS (CoreDNS, which EKS runs as a managed add-on), share a PostgreSQL database, and deploy independently. Critically, every service exposes a
/health endpoint for Kubernetes probes and a /metrics endpoint for Prometheus; the latter is the foundation on which everything else rests.EKS note - container images: On a local cluster you can use locally built images. On EKS, each service image must live in a registry the cluster can pull from. Create an Amazon ECR repo per service and push:
aws ecr create-repository --repository-name pulseshield/order-service
 aws ecr get-login-password --region us-east-1
docker login --username AWS --password-stdin <ACCOUNT_ID>.dkr.ecr.us-east-1.amazonaws.com
docker tag order-service:latest <ACCOUNT_ID>.dkr.ecr.us-east-1.amazonaws.com/pulseshield/order-service:latest
docker push <ACCOUNT_ID>.dkr.ecr.us-east-1.amazonaws.com/pulseshield/order-service:latestThen update each Deployment's
image: field to the ECR URI. Managed node groups already have ECR pull permissions in their node role, so no imagePullSecret is needed.Step 2: Instrument Every Request
The goal is to make every HTTP transaction leave a trace: how long it took and whether it succeeded. This code is identical to a non-EKS build - instrumentation lives in the application, not the platform.
Both the order and inventory services attach a middleware layer that records two metrics per request: a histogram for latency distribution and a counter for totals, both labeled by HTTP method, route, and status code.
order-service/index.js (Node.js / Express):
1
2
3
4
5
6
7
8
9
10
11
12
13
14
15
16
17
18
19
20
21
22
23
24
25
26
27
28
29
30
31
32
33
34
35
36
37
38
39
40
41
42
43
44
45
46
47
48
49
50
51
52
53
54
55
56
57
58
59
60
61
62
63
64
65
66
67
68
69
70
71
72
73
74
75
76
77
78
79
80
81
82
83
84
85
86
87
88
89
90
91
92
93
94
95
96
const express = require('express');

const { Pool } = require('pg');

const promClient = require('prom-client');

const winston = require('winston');


const app = express();

app.use(express.json());


const logger = winston.createLogger({

  level: 'info',

  format: winston.format.json(),

  transports: [new winston.transports.Console()]

});


const register = new promClient.Registry();

promClient.collectDefaultMetrics({ register });


const httpRequestDuration = new promClient.Histogram({

  name: 'http_request_duration_seconds',

  help: 'Duration of HTTP requests in seconds',

  labelNames: ['method', 'route', 'status'],

  registers: [register]

});


const httpRequestTotal = new promClient.Counter({

  name: 'http_requests_total',

  help: 'Total HTTP requests',

  labelNames: ['method', 'route', 'status'],

  registers: [register]

});


const pool = new Pool({

  host: process.env.DB_HOST || 'postgres',

  port: process.env.DB_PORT || 5432,

  database: process.env.DB_NAME || 'orders',

  user: process.env.DB_USER || 'postgres',

  password: process.env.DB_PASSWORD || 'postgres',

  ssl: process.env.DB_SSL === 'false' ? false : { rejectUnauthorized: false }

});


pool.query(`

  CREATE TABLE IF NOT EXISTS orders (

    id SERIAL PRIMARY KEY,

    customer_name VARCHAR(255),

    product VARCHAR(255),

    quantity INT,

    created_at TIMESTAMP DEFAULT NOW()

  )

`).catch(err => logger.error('DB init error:', err));


app.use((req, res, next) => {

  const end = httpRequestDuration.startTimer();

  res.on('finish', () => {

    end({ method: req.method, route: req.route?.path || req.path, status: res.statusCode });

    httpRequestTotal.inc({ method: req.method, route: req.route?.path || req.path, status: res.statusCode });

  });

  next();

});


app.post('/orders', async (req, res) => {

  try {

    const { customer_name, product, quantity } = req.body;

    const result = await pool.query(

      'INSERT INTO orders (customer_name, product, quantity) VALUES ($1, $2, $3) RETURNING *',

      [customer_name, product, quantity]

    );

    logger.info('Order created', { orderId: result.rows[0].id });

    res.status(201).json(result.rows[0]);

  } catch (err) {

    logger.error('Order creation failed', { error: err.message });

    res.status(500).json({ error: 'Internal server error' });

  }

});


app.get('/orders/:id', async (req, res) => {

  try {

    const result = await pool.query('SELECT * FROM orders WHERE id = $1', [req.params.id]);

    if (result.rows.length === 0) return res.status(404).json({ error: 'Order not found' });

    res.json(result.rows[0]);

  } catch (err) {

    logger.error('Order fetch failed', { error: err.message });

    res.status(500).json({ error: 'Internal server error' });

  }

});


app.get('/health', (req, res) => {

  res.json({ status: 'healthy', service: 'order-service' });

});


app.get('/metrics', async (req, res) => {

  res.set('Content-Type', register.contentType);

  res.end(await register.metrics());

});


const PORT = process.env.PORT || 3000;

app.listen(PORT, () => logger.info(`Order service running on port ${PORT}`));
inventory-service/main.py (Python / FastAPI):
1
2
3
4
5
6
7
8
9
10
11
12
13
14
15
16
17
18
19
20
21
22
23
24
25
26
27
28
29
30
31
32
33
34
35
36
37
38
39
40
41
42
43
44
45
46
47
48
49
50
51
52
53
54
55
56
57
from fastapi import FastAPI, HTTPException
from prometheus_client import Counter, Histogram, generate_latest, CONTENT_TYPE_LATEST
from fastapi.responses import Response
import logging
import os
logging.basicConfig(level=logging.INFO, format='%(asctime)s - %(levelname)s - %(message)s')
logger = logging.getLogger(__name__)
app = FastAPI(title="Inventory Service")
inventory_db = {
"laptop": {"stock": 50, "price": 999.99},
"phone": {"stock": 100, "price": 699.99},
"tablet": {"stock": 75, "price": 499.99}
}
http_requests_total = Counter('http_requests_total', 'Total HTTP requests', ['method', 'endpoint', 'status'])
http_request_duration = Histogram('http_request_duration_seconds', 'HTTP request duration', ['method', 'endpoint'])
async def metrics_middleware(request, call_next):
with http_request_duration.labels(method=request.method, endpoint=request.url.path).time():
response = await call_next(request)
http_requests_total.labels(method=request.method, endpoint=request.url.path, status=response.status_code).inc()
return response
async def get_inventory(product: str):
if product not in inventory_db:
logger.warning(f"Product not found: {product}")
raise HTTPException(status_code=404, detail="Product not found")
logger.info(f"Inventory checked for: {product}")
return inventory_db[product]
async def reduce_inventory(product: str, quantity: int):
if product not in inventory_db:
raise HTTPException(status_code=404, detail="Product not found")
if inventory_db[product]["stock"] < quantity:
raise HTTPException(status_code=400, detail="Insufficient stock")
inventory_db[product]["stock"] -= quantity
logger.info(f"Reduced {quantity} units of {product}")
return {"product": product, "remaining_stock": inventory_db[product]["stock"]}
async def health():
return {"status": "healthy", "service": "inventory-service"}
async def metrics():
return Response(content=generate_latest(), media_type=CONTENT_TYPE_LATEST)
if __name__ == "__main__":
import uvicorn
port = int(os.getenv("PORT", 8000))
uvicorn.run(app, host="0.0.0.0", port=port)This raw, labeled telemetry is the input to every query the agent will ever run. No instrumentation, no agent. Both services follow the same three-part pattern: two labeled metrics (a Histogram for latency, a Counter for requests, both labeled by method/route/status); one middleware that wraps every request to record duration and status; and a /metrics endpoint that Prometheus scrapes every 15 seconds. Because both services emit the same metric names and labels, Prometheus sees one uniform schema regardless of language - which is why a single PromQL query in Step 5 works across every service.
Step 3: Scrape and Visualize the Metrics
Prometheus scrapes each service every 15 seconds. Static targets handle known services; a Kubernetes service-discovery config with pod-annotation filtering picks up anything new without config changes. This service discovery works identically on EKS - it queries the same Kubernetes API. Grafana sits on top for human-readable dashboards.
EKS note - kube-state-metrics: The crash-loop query in Step 5 depends on
kube_pod_container_status_restarts_total, produced by kube-state-metrics. A fresh EKS cluster does not ship this by default, so deploy it. The kube-prometheus-stack Helm chart bundles Prometheus, Grafana, and kube-state-metrics together and is the simplest way to get all three on EKS:helm repo add prometheus-community https://prometheus-community.github.io/helm-chartshelm install monitoring prometheus-community/kube-prometheus-stack -n pulseshieldEKS note - managed alternative (optional): You can instead use Amazon Managed Service for Prometheus (AMP) and Amazon Managed Grafana (AMG). The PromQL is unchanged; only the remote-write and query endpoints differ, and the agent's IRSA role (Step 7) gains aps:QueryMetrics permission. Self-hosting and AMP are equally valid - pick based on how much you want to operate yourself.

Figure 2: Prometheus scrape targets. inventory-service and order-service show State = UP, confirming the Step 2 instrumentation is live and being collected.

Figure 3: The Grafana dashboard - request rate, P99 latency, error rate, and pod restarts per service. This is the baseline the agent learns to deviate from.
A green UP across your services is the green light to move on. The four dashboard panels are built on the Step 2 metrics, and they are exactly what spike during the incident in Step 5.
Step 4: Run a Monitoring Loop
In this step, the goal is to move from only watching to watching, reasoning, and acting.
Most observability stops at the dashboard: the system watches, and humans respond. The AI agent service instead runs a loop every 60 seconds that, on each iteration, queries Prometheus for anomalies, passes any findings to Claude for diagnosis, executes the recommended remediation via the Kubernetes API, and autonomously sends a structured report to Slack, with no human in the decision path.
The loop runs in a background daemon thread, so the FastAPI app stays responsive for health checks. Each iteration is self-contained and exception-safe, so a failure in one cycle can't crash the next.
1
2
3
4
5
6
7
8
9
10
11
12
13
14
15
16
17
18
19
20
21
22
23
24
25
26
27
28
29
30
def monitoring_loop():

    logger.info("AI Agent monitoring started")

    while True:

        try:

            anomalies = detect_anomalies()

            if anomalies:

                logger.info(f"Detected {len(anomalies)} anomalies")

                for anomaly in anomalies:

                    metrics_snapshot = query_prometheus(f'{{job="{anomaly["service"]}"}}')

                    ai_response = analyze_with_ai(anomaly, metrics_snapshot)

                    action = ai_response.get("action", "alert")

                    reasoning = ai_response.get("reasoning", "No reasoning provided")

                    remediation_result = execute_remediation(action, anomaly['service'])

                    message = build_slack_message(anomaly, ai_response, remediation_result)

                    send_slack_notification(message)

                    log_incident({

                        'service': anomaly['service'],

                        'anomaly_type': anomaly['type'],

                        'metrics': anomaly,

                        'ai_diagnosis': reasoning,

                        'action': remediation_result,

                        'status': 'resolved' if action != 'alert' else 'alerted',

                        'slack_sent': True

                    })

            else:

                logger.info("No anomalies detected")

            time.sleep(60)

        except Exception as e:

            logger.error(f"Monitoring loop error: {e}")

            time.sleep(60)
Step 5: Detect Anomalies with PromQL
Detection rests on three PromQL queries, unchanged on EKS:
# 1. Five-minute error rate across all 4xx/5xx responsesrate(http_requests_total{status=~"4..|5.."}[5m])# 2. P99 latencyhistogram_quantile(0.99, rate(http_request_duration_seconds_bucket[5m]))# 3. Pod restarts in the last 10 minutes (crash-loop signal)increase(kube_pod_container_status_restarts_total[10m])The 1% error-rate threshold isn't arbitrary: below it, errors are usually bots and malformed requests; above it, real customers are failing at checkout. Above one second of P99 latency, the hit to conversion is well established. More than one restart in ten minutes is a crash loop, not a blip. Each confirmed anomaly becomes a structured record - service, type, observed value, threshold - that serves as Claude's starting point.

Figure 4: The error-rate query in the Prometheus expression browser. Two series stand out - a flood of 404s to /inventory/does-not-exist and 500s on order-service's /orders/:id, both hundreds of times above the 1% threshold.
Step 6: Turn Claude into a Diagnosis Engine
When an anomaly fires, the agent doesn't notify; it first asks Claude to think. Claude receives the anomaly details and a full metrics snapshot and is prompted to respond as a senior DevOps engineer, returning a strict JSON contract. This code is identical on EKS.
1
2
3
4
5
6
7
8
9
10
11
12
13
14
15
16
17
18
19
20
21
22
23
24
25
26
27
28
29
30
31
32
33
34
35
36
37
38
39
40
41
42
43
44
45
46
47
48
49
50
51
52
53
54
55
56
57
58
59
60
61
62
63
def analyze_with_ai(anomaly, metrics_snapshot):

    if not anthropic_client:

        return {

            "action": "alert",

            "severity": "medium",

            "summary": "AI not configured",

            "root_cause": "N/A",

            "impact": "N/A",

            "reasoning": "AI not configured",

            "remediation_steps": ["Check AI agent configuration"]

        }


    prompt = f"""You are a senior DevOps AI agent monitoring a Kubernetes microservices platform called PulseShield AI.


An anomaly has been detected. Analyze it thoroughly and respond with a detailed incident report.


Anomaly Details:

{json.dumps(anomaly, indent=2)}


Metrics Snapshot:

{json.dumps(metrics_snapshot, indent=2)}


Provide your response as JSON only with this exact structure:

{{

  "action": "restart|scale|alert",

  "severity": "low|medium|high|critical",

  "summary": "one sentence summary of the issue",

  "root_cause": "likely root cause of the anomaly",

  "impact": "what is the impact on users and the system",

  "reasoning": "detailed explanation of your analysis",

  "remediation_steps": ["step 1", "step 2", "step 3"],

  "scale_replicas": 3

}}"""


    try:

        message = anthropic_client.messages.create(

            model=CLAUDE_MODEL,

            max_tokens=2048,

            messages=[{"role": "user", "content": prompt}]

        )

        response_text = message.content[0].text

        start = response_text.find("{")

        end = response_text.rfind("}") + 1

        if start == -1 or end == 0:

            raise ValueError(f"No JSON in response: {response_text[:200]}")

        return json.loads(response_text[start:end], strict=False)

    except Exception as e:

        logger.error(f"AI analysis failed: {e}")

        return {

            "action": "alert",

            "severity": "high",

            "summary": f"Anomaly detected on {anomaly.get('service', 'unknown')}",

            "root_cause": f"Metric value {anomaly.get('value')} exceeded threshold {anomaly.get('threshold')}",

            "impact": "Service degradation detected. Users may experience errors or slow responses.",

            "reasoning": f"Automated detection triggered. AI analysis unavailable: {str(e)}",

            "remediation_steps": [

                f"Check logs: kubectl logs -l app={anomaly.get('service')} -n pulseshield",

                f"Check pods: kubectl get pods -n pulseshield",

                f"Restart: kubectl rollout restart deployment/{anomaly.get('service')} -n pulseshield",

                "Monitor metrics in Grafana dashboard",

                "Escalate to on-call engineer if issue persists"

            ]

        }
The action field is the only one the automation acts on: restart, scale, or alert. severity drives the Slack indicator; summary, root_cause, impact, and reasoning are the human-readable fields; remediation_steps is an ordered fallback list; scale_replicas is a suggested count. Demanding JSON in this exact structure is what makes the model's answer safe to automate against - there's no free text to misparse.
Step 7: Let the Diagnosis Drive EKS
The remediation code is unchanged - the Python Kubernetes client uses in-cluster config and a mounted ServiceAccount token, which works identically against the EKS-managed API server. What changes on EKS is how the agent's identity is established (IRSA) and how authorization is wired.
A restart uses a deployment annotation patch (a rolling restart, zero dropped requests). A scale is additive - current replicas + 2 - so it never overwrites an operator's manual scaling.
1
2
3
4
5
6
7
8
9
10
11
12
13
14
15
16
17
18
19
20
21
22
23
24
25
def execute_remediation(action, service, namespace="pulseshield"):

    try:

        if action == "restart":

            k8s_apps.patch_namespaced_deployment(

                name=service,

                namespace=namespace,

                body={"spec": {"template": {"metadata": {"annotations": {"kubectl.kubernetes.io/restartedAt": datetime.now().isoformat()}}}}}

            )

            logger.info(f"Restarted deployment: {service}")

            return "restarted"

        elif action == "scale":

            deployment = k8s_apps.read_namespaced_deployment(service, namespace)

            current_replicas = deployment.spec.replicas

            new_replicas = current_replicas + 2

            k8s_apps.patch_namespaced_deployment_scale(

                name=service,

                namespace=namespace,

                body={"spec": {"replicas": new_replicas}}

            )

            logger.info(f"Scaled {service} from {current_replicas} to {new_replicas}")

            return f"scaled to {new_replicas}"

        return "alert_only"

    except Exception as e:

        logger.error(f"Remediation failed: {e}")

        return f"failed: {e}"
The agent's cluster access is scoped through a dedicated ServiceAccount and ClusterRole granting only get/list/patch/update on deployments and deployments/scale, plus read on pods. On EKS the ServiceAccount carries one extra piece - an IRSA annotation that binds it to an IAM role:
1
2
3
4
5
6
7
8
9
10
11
12
13
14
15
16
17
18
19
20
21
22
23
24
25
26
27
28
29
30
31
32
33
34
35
36
37
apiVersion: v1

kind: ServiceAccount

metadata:

  name: ai-agent-sa

  namespace: {{ .Values.global.namespace }}

  annotations:

    # EKS / IRSA: binds this ServiceAccount to an IAM role.

    # Only needed if the agent calls AWS APIs (e.g. AMP, Secrets Manager).

    # Kubernetes-API-only remediation works without it.

    eks.amazonaws.com/role-arn: arn:aws:iam::<ACCOUNT_ID>:role/pulseshield-ai-agent


---

apiVersion: rbac.authorization.k8s.io/v1

kind: ClusterRole

metadata:

  name: ai-agent-role

rules:

- apiGroups: ["apps"]

  resources: ["deployments", "deployments/scale"]

  verbs: ["get", "list", "patch", "update"]

- apiGroups: [""]

  resources: ["pods"]

  verbs: ["get", "list", "delete"]


---

apiVersion: rbac.authorization.k8s.io/v1

kind: ClusterRoleBinding

metadata:

  name: ai-agent-binding

subjects:

- kind: ServiceAccount

  name: ai-agent-sa

  namespace: {{ .Values.global.namespace }}

roleRef:

  kind: ClusterRole

  name: ai-agent-role

  apiGroup: rbac.authorization.k8s.io
EKS note - two distinct authorization layers, the part people get wrong when moving to EKS:
• Kubernetes RBAC (the ClusterRole above) controls what the agent can do to deployments and pods. Unchanged from vanilla Kubernetes.
• IAM controls who can reach the cluster and what AWS APIs the agent can call. The IRSA role only matters if the agent talks to AWS services; for pure in-cluster restart/scale, the in-cluster token is sufficient.
Create the IRSA role with eksctl:
eksctl create iamserviceaccount \ --name ai-agent-sa \ --namespace pulseshield \ --cluster pulseshield \ --role-name pulseshield-ai-agent \ --approveHuman/operator access to the cluster is governed separately by EKS access entries (the modern replacement for the aws-auth ConfigMap) - map your IAM roles to Kubernetes groups there so your team can run kubectl.
EKS note - capacity for the scale action: On a single-node local cluster,
current_replicas + 2 just packs onto the one node. On EKS, scaling out can exhaust node capacity and leave pods Pending. Install Karpenter (or Cluster Autoscaler) so new nodes are provisioned automatically when the agent scales a service. Without it, the scale action succeeds at the API level but pods may never schedule.NOTE: The
restart/scale actions execute against the EKS cluster. Without cluster credentials wired up, the agent still detects, diagnoses, reports, and logs - it simply records alert_only. Before pointing the agent at a production EKS cluster, confirm both the IRSA mapping and the RBAC binding are in place; an agent that can patch deployments is worth testing carefully against a non-prod cluster first.Step 8: Deliver the Incident Report to Slack
After every cycle, the agent posts a structured report built from every field of Claude's response: a severity indicator, the metric value next to its threshold, and the AI analysis - summary, root cause, user impact, reasoning, and ordered remediation steps. Unchanged on EKS.

Figure 5: The incident report the agent posts to Slack - severity, metric value vs threshold, summary, root cause, impact, and full AI analysis.
The old alert says “Something is wrong with order service.” This says: here is what happened, here is why, here is what the system already did, and here is what to do if that wasn't enough. That's the difference between being woken to solve a problem and being woken to review a solution.
EKS note - secrets: The Slack webhook URL, Claude API key, and DB credentials shouldn't be hardcoded. On EKS, store them in AWS Secrets Manager and surface them with the External Secrets Operator (or the Secrets Store CSI driver), authorized via the agent's IRSA role. A plain Kubernetes Secret also works for a first deploy.
Expose the Gateway with an AWS Load Balancer
On a local cluster the Nginx gateway is reached via NodePort or port-forward. On EKS you front it with a real AWS load balancer. Install the AWS Load Balancer Controller, then expose the gateway with an ALB Ingress:
1
2
3
4
5
6
7
8
9
10
11
12
13
14
15
16
17
18
19
20
apiVersion: networking.k8s.io/v1

kind: Ingress

metadata:

  name: pulseshield-gateway

  namespace: pulseshield

  annotations:

    kubernetes.io/ingress.class: alb

    alb.ingress.kubernetes.io/scheme: internet-facing

    alb.ingress.kubernetes.io/target-type: ip

spec:

  rules:

  - http:

      paths:

      - path: /

        pathType: Prefix

        backend:

          service:

            name: nginx-gateway

            port:

              number: 80
The controller provisions an Application Load Balancer in your VPC and keeps its target group in sync with the gateway's pods. For a layer-4 path instead, expose the gateway as a Service of type LoadBalancer and the controller provisions a Network Load Balancer.
Step 9: Persist Every Incident
Before the Slack message goes out, every incident is written to a PostgreSQL incidents table:
1
2
3
4
5
6
7
8
9
10
11
CREATE TABLE IF NOT EXISTS incidents (

    id SERIAL PRIMARY KEY,

    timestamp TIMESTAMP DEFAULT NOW(),

    service VARCHAR(255),

    anomaly_type VARCHAR(255),

    metrics_snapshot TEXT,   -- full Prometheus response: reproducible

    ai_diagnosis TEXT,       -- Claude's reasoning, not just the action

    remediation_action VARCHAR(255),

    status VARCHAR(50),

    slack_sent BOOLEAN DEFAULT FALSE

);
EKS note - where Postgres lives, the one piece of state that must survive pod restarts:
• Recommended for production: Amazon RDS for PostgreSQL. Point DB_HOST at the RDS endpoint and drop the in-cluster Postgres deployment entirely. RDS handles backups, failover, and patching, and survives the cluster itself.
• In-cluster option: keep Postgres as a StatefulSet, but back its PersistentVolumeClaim with the EBS CSI driver (installed in Step 0) so data lives on a durable EBS volume. An emptyDir volume loses every incident on reschedule.

Figure 6: The incidents table - the audit trail of recent anomalies, each with action, status, and timestamp. (alert_only here because this run had no cluster; a live EKS run would also show restarted/scaled.)

Figure 7: The stored ai_diagnosis column for the latest incident, holding Claude's full reasoning. The table records why, not just the action.
Over time, this table becomes a dataset: you can measure how often automated restarts actually resolve incidents versus when a human is needed, see which services fail most often, and audit and tune the agent's decisions.
Possible Tradeoffs to Consider
1. Why not just use AlertManager? Its rules are static: IF error_rate > 0.01 FOR 5m THEN page fires identically whether the cause is a bad deploy, a saturated database, or a DDoS spike - yet the right response to each differs. Claude reads context; a static rule can't. Use AlertManager for routing and dedup at scale, and the agent for intelligent triage.
2. Why Slack, not PagerDuty? Slack is where the team already lives and carries the rich briefing. In production, run both - PagerDuty to wake people up for critical incidents and Slack to tell them what happened before they're fully awake.
3. Self-managed vs AWS-managed building blocks. On EKS you can run Prometheus/Grafana and Postgres yourself, or lean on AMP/AMG and RDS. Managed services cost more and give less control but remove operational toil. The agent's logic is identical either way; only endpoints and IAM permissions change.
What Does This Change About On-Call?
The most important shift isn't speed of remediation; it's the nature of the work that remains. Traditionally the on-call engineer is the intelligence layer - receiving a signal, applying judgment, deciding, executing - done worst at 2:47 AM on broken sleep. This agent moves that intelligence into the system for incidents with clear remediation patterns: connection pool exhaustion, traffic spikes, crash loops. For those, the engineer becomes an auditor: review a completed action, confirm it was right, go back to sleep. For everything else, they arrive at a Slack message that has already done the diagnostic work.
The Gap Is Smaller Than You Think
The core pattern of detect, diagnose, and act is a few hundred lines of Python and a well-structured Claude prompt on top of Prometheus. Treat Claude not as a chatbot but as a structured reasoning engine: precise inputs, precise machine-readable outputs, nuance preserved in the fields humans read rather than the code paths that execute.
Prometheus collects the signal, Claude interprets it, EKS acts on the interpretation, and Slack keeps humans in the loop. Running it on EKS doesn't change that loop - it just makes the platform underneath it managed, durable, and ready for production scale. For e-commerce especially, where every minute of degraded service costs real money, the case is about systems that are resilient by default - platforms that don't wait to be told something is wrong because they already know and have already acted.
Enjoyed reading this content? Let the author know!
Your likes, comments, shares, and saves help creators reach more builders.

Loading recommendations
Loading article