
Performance Tuning with CloudWatch Database Insights
Building on what Amazon RDS Performance Insights offers, Amazon CloudWatch Database Insights launched in December of 2024. CloudWatch Database Insights provides a superset of functionality Performance Insights offered, adding powerful new features like fleet-level monitoring, lock analysis, execution plan capture, performance analysis on demand, and integration with Amazon CloudWatch Application Signals to correlate database performance events with segments of application code.


This episode CloudWatch Database Insights, a comprehensive database monitoring solution that consolidates multiple AWS monitoring tools into a unified platform. The tool is set to replace Performance Insights by November 30, 2025, offering automatic migration with no downtime required.
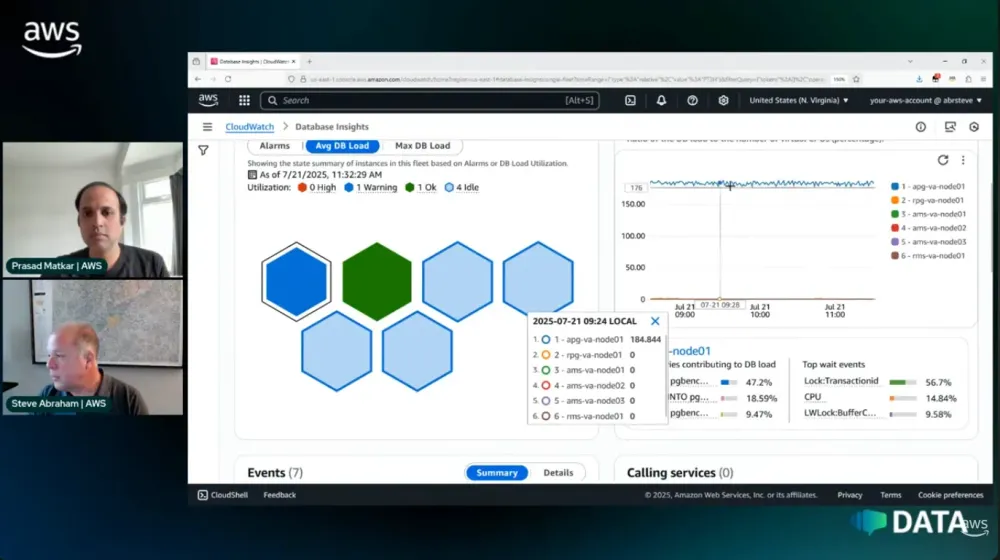
CloudWatch Database Insights provides a single pane of glass for database observability, combining CloudWatch metrics, logs, enhanced monitoring, and Performance Insights capabilities. The platform supports all AWS relational databases including Aurora, MySQL, PostgreSQL, Oracle, and SQL Server. Key innovations include fleet monitoring with honeycomb visualization for at-a-glance health status, lock analysis that identifies blocking chains every 15 seconds, and proactive execution plan capture to detect performance regressions.
The hosts demonstrated real-world troubleshooting scenarios showing how Database Insights enables rapid problem identification from fleet-level overview down to specific query details. The tool's integration with CloudWatch Application Signals allows teams to correlate database performance issues directly with application code, making it valuable for both DBAs and developers. Historical analysis capabilities with up to 15 months retention enable teams to compare performance across different time periods and identify trends.
Key Highlights:
- Unified monitoring dashboard consolidating multiple tools (CloudWatch metrics, logs, enhanced monitoring, Performance Insights)
- Fleet monitoring with color-coded honeycomb visualization (red for high load, blue for idle)
- Lock analysis identifying blocking chains and deadlocks every 15 seconds
- On-demand performance analysis reports with actionable recommendations
- Execution plan capture to identify query plan regressions over time
- Application integration correlating database activity with application code via CloudWatch Application Signals
- Multi-dimensional filtering by users, hosts, applications, and custom groupings
- Cross-engine support for all AWS relational databases
Hosts of the show
Prasad Matkar - Senior Database Specialist @AWS
Guests
Steve Abraham - Prin WW SSA MySQL @AWS
Links from today's episode
Enjoyed reading this content? Let the author know!
Your likes, comments, shares, and saves help creators reach more builders.

Loading recommendations
Loading article