

Troubleshooting AWS Glue Jobs
AWS Glue is a powerful serverless ETL service designed to simplify data integration tasks at scale. However, like any data engineering tool, Glue jobs can—and will—fail due to a variety of issues: configuration errors, data mismatches, IAM permission problems, or underlying infrastructure limits. This post is a practical guide to troubleshooting AWS Glue jobs.

AWS Glue Job Types
Before troubleshooting, it helps to understand what kind of job you're dealing with. AWS Glue offers several job types, each with its own nuances:
- Spark jobs (for large-scale ETL in PySpark or Scala)
- Python shell jobs (for lightweight scripting or orchestration)
- Ray jobs (for distributed Python workloads)
- Glue Studio visual jobs (low-code PySpark workflows)
- Streaming jobs (event-driven data transformation)
With each of the different types of jobs, there may be different logs, memory profiles, and error surfaces. For the sake of simplicity, this article will focus primarily on Spark-based Glue jobs, which are the most common type of Glue ETL job.
Top Categories of Failures
Glue job failures typically fall into one of the following categories:
Category | Examples |
|---|---|
Syntax or Script Errors | Bad Python syntax, undefined variables |
Data Issues | Missing columns, null values, schema mismatch |
Resource Constraints | Out of memory, executor timeouts, slow S3 I/O |
Permissions and Access | S3 access denied, JDBC auth failure |
Configuration Mistakes | Wrong paths, invalid file formats, wrong encodings |
External Dependency Failures | JDBC source offline, API call rate-limited, etc. |
Each type produces different logs and symptoms. The faster you identify the category, the quicker you can resolve it.
Tools and Logs for Debugging
AWS provides several layers of logging and monitoring tools that you can use together to help pinpoint the issue. A good place to start is with the AWS Glue Console, where you can monitor job runs.
Job Run Monitoring console
To get to the monitoring page, login to the AWS Management Console and navigate to the AWS Glue console. From the menu on the left-hand side, under the heading Data Integration and ETL navigate to ETL Jobs > Job Run Monitoring.
This will open the Monitor job runs page shown below—this page has been designed to make it easy to monitor and troubleshoot AWS Glue jobs

In the run status, you can see the current status of your Glue jobs. For a successful job, you may observe the status move through STARTING, RUNNING, STOPPING, STOPPED and finally, SUCCEEDED.
For jobs that are not successful, there are a number of statuses that you may see in the monitoring console, including FAILED, ERROR, WAITING or TIMEOUT. If you see one of these statuses, you may need to do some investigation.
The most important thing to note is the error message or warning that appears in the banner on this page. This will give you the details you need to start troubleshooting.

Below are some of tools you can use to investigate and troubleshoot your AWS Glue jobs.
Troubleshooting with GenAI (Preview)
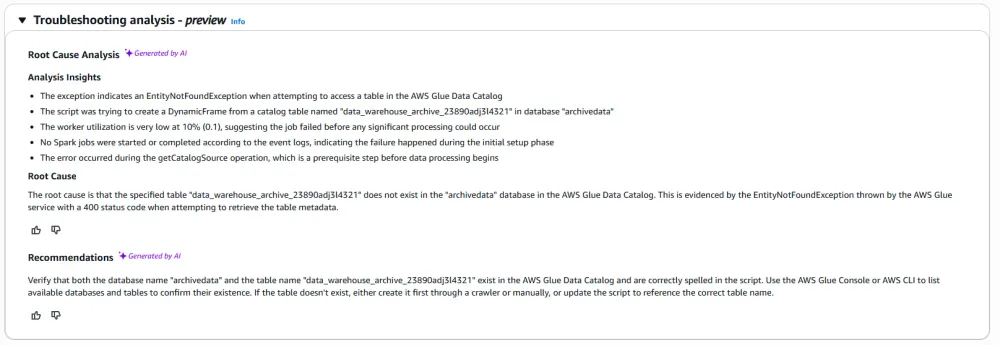
Within the Job Run monitoring console, you now have the ability to use GenAI to troubleshoot your Apache Spark ETL jobs. Using this feature, you can analyse your Spark jobs and determine the root cause of what is wrong, and also get recommendations on how you can resolve any issues found.
Note: As of June 2025, this feature is currently in preview and supports Glue 4.0 and 5.0 Spark jobs. Please check the documentation here for supported AWS regions and other important information regarding the preview.
To start troubleshooting with GenAI, select a failed ETL job in the Job monitoring page from the Job runs table, then use the Actions drop-down menu to select Troubleshoot with AI. This will take you to the Run details page for that particular job. Scroll down the page until you see the section marked Troubleshooting analysis – Preview.
This new feature will analyse your AWS Glue Job and do a root cause analysis. The output from this analysis will be a concise list of analysis insights. These insights provide you with details of the error and key processing metrics and observations. It will also infer a root cause for the problem, and make recommendations on how to troubleshoot your Glue job, as shown below:
Understanding AWS Glue Logs
For diving deep into your AWS Glue Jobs, there are a number of logs you can review and they can provide the detailed information you may need to troubleshoot errors and performance issues.
CloudWatch Logs
You have access to the standard output and error logs from the Run Details page, which will enable you to dive deep on errors. To view theses logs, in the AWS Glue console, navigate to ETL Jobs > Job run monitoring to see a list of jobs. Then click to select the job you want to troubleshoot and click the View run details button to get to the Run details page.
From the Run details page, you can access the CloudWatch logs, selecting either All Logs, Output Logs or Error Logs. When you select one of these options, you will be taken to the CloudWatch console and the logs will be filtered for the specific job run ID for the job run you are looking at.
You can click on the log to view Log Events—there is a search bar in the log events page. You can search for the keywords of ERROR or EXCEPTION and then look through the log to find the error message or more information.
Spark UI
Another helpful source of troubleshooting information is the Spark UI that is available within AWS Glue. Within the Glue console, you can use the Apache Spark web UI to monitor and debug AWS Glue ETL jobs running on the AWS Glue job system.
You can view the Spark UI from the Job Run details page and the UI itself is organized into a number of different tabs, which are detailed below:
Jobs
The Jobs tab provides a high-level overview of all Spark jobs executed within your AWS Glue application. This tab displays essential information including job IDs, submission times, completion status, total duration, and the number of stages per job. When troubleshooting performance issues, this tab serves as your starting point to quickly identify which jobs are consuming the most time or experiencing failures. You can click on individual job IDs to drill down into more detailed information about specific job execution patterns.
Information available: Job ID and descriptive names • Submission and completion timestamps • Overall job duration metrics • Stage count per job • Success/failure status indicators • Progress bars for running jobs
Stages
The Stages tab offers detailed insights into the execution stages that comprise your Spark jobs. Each stage represents a set of tasks that can be executed in parallel, and this tab reveals critical performance metrics including task progress, input/output data volumes, shuffle operations, and stage duration. This is particularly valuable for identifying performance bottlenecks, data skew issues, and inefficient transformations that may be causing your AWS Glue jobs to run slowly.
Information available: Stage ID and associated job information • Task completion progress and metrics • Input and output data size measurements • Shuffle read and write operation details • Stage execution timeline and duration • Failed task indicators and error details
Storage
The Storage tab focuses on data caching and memory utilization within your Spark application. It displays information about cached RDDs (Resilient Distributed Datasets) and DataFrames, showing how much memory is being used for caching, which partitions are stored in memory versus disk, and the overall efficiency of your caching strategy. This tab is crucial for optimizing memory usage and identifying situations where excessive caching might be causing memory pressure in your AWS Glue jobs.
Information available: Cached RDD and DataFrame listings • Storage levels (memory, disk, or both) • Memory usage per cached dataset • Partition distribution across storage tiers • Cache hit ratios and efficiency metrics • Storage fraction utilized
Environment
The Environment tab provides comprehensive information about the Spark configuration and runtime environment for your AWS Glue job. This includes Spark configuration parameters, JVM settings, system properties, and Hadoop configuration details. When debugging configuration-related issues or comparing performance across different job runs, this tab helps verify that your jobs are running with the expected settings and resource allocations.
Information available: Spark configuration parameters and values • JVM runtime settings and properties • System environment variables • Hadoop and AWS-specific configurations • Version information for Spark and dependencies • Custom configuration overrides
Executors
The Executors tab delivers detailed information about the compute resources allocated to your Spark application, including individual executor performance metrics. You can monitor memory usage patterns, CPU utilization, task execution statistics, and garbage collection behavior across all executors. This tab is essential for identifying resource bottlenecks, executor failures, and optimizing the resource allocation for your AWS Glue jobs.
Information available: Executor ID and status information • Memory usage breakdown (on-heap and off-heap) • CPU time and utilization statistics • Active, completed, and failed task counts • Garbage collection time and frequency • Network I/O and disk usage metrics
SQL/Dataframe
The SQL tab focuses specifically on SQL query execution when your AWS Glue jobs use DataFrame operations or Spark SQL. It displays query execution plans, both logical and physical, along with detailed timing information for each query operation. This tab is invaluable for optimizing complex data transformations, understanding join strategies, and debugging performance issues in SQL-heavy ETL operations.
Information available: Query execution plans (logical and physical) • Query duration and timing breakdowns • Data exchange and shuffle operation details • Join strategy information and optimization hints • Catalyst optimizer decisions and transformations • Query-specific performance metrics
AWS CloudTrail
If you are trying to track down permission errors, you can also use CloudTrail to see access-denied events. To access CloudTrail events, navigate to the AWS CloudTrail console and navigate to the "Event history" section. You can then filter on the eventSource for glue.amazonaws.com.
For permission errors, here are the key details to look for:
- eventName: Specific Glue API call that was denied
- sourceIPAddress: Source of the request
- userIdentity: Details about the IAM user/role attempting access
- requestParameters: Specific resources or actions that were blocked
If there is an error, you may need to review your IAM policies, and check IAM role permissions and adjust as needed.
Understanding Common Errors
A good place to start with some of the most common errors for AWS Glue is with the list of errors included in the AWS Glue documentation, which is available from here. In the AWS Glue Github repository, there is also a list of Frequently Asked Questions and some common errors you may encounter.
Summary and Resources
Troubleshooting AWS Glue jobs requires a structured approach—starting with identifying the failure type, examining logs, and narrowing down to root causes. You can the the Glue console, CloudWatch logs, and Spark UI together to help troubleshoot and optimize your AWS Glue jobs (and with a little help from AI as well!)
Additional Resources:
Enjoyed reading this content? Let the author know!
Your likes, comments, shares, and saves help creators reach more builders.

Loading recommendations
Loading article