
Monitor your Serverless Application with AWS CloudWatch
Monitoring serverless applications with AWS CloudWatch, covering key metrics and alarms for API Gateway, Lambda, DynamoDB, and SES services.

Introduction
Serverless applications have become increasingly popular due to their scalability and reduced operational overhead. However, monitoring these applications presents unique challenges compared to traditional server-based architectures.
This blog post will guide you through effectively monitoring a serverless application using AWS CloudWatch.
Problem
While serverless applications reduce operational complexity, they introduce new monitoring challenges. Unlike traditional applications where you have full control over the server environment, serverless architectures distribute responsibilities across multiple managed services. This distribution can make it harder to:
- Track application performance across different services
- Identify the root cause of errors
- Monitor resource utilization and costs
- Ensure reliable email delivery in serverless workflows
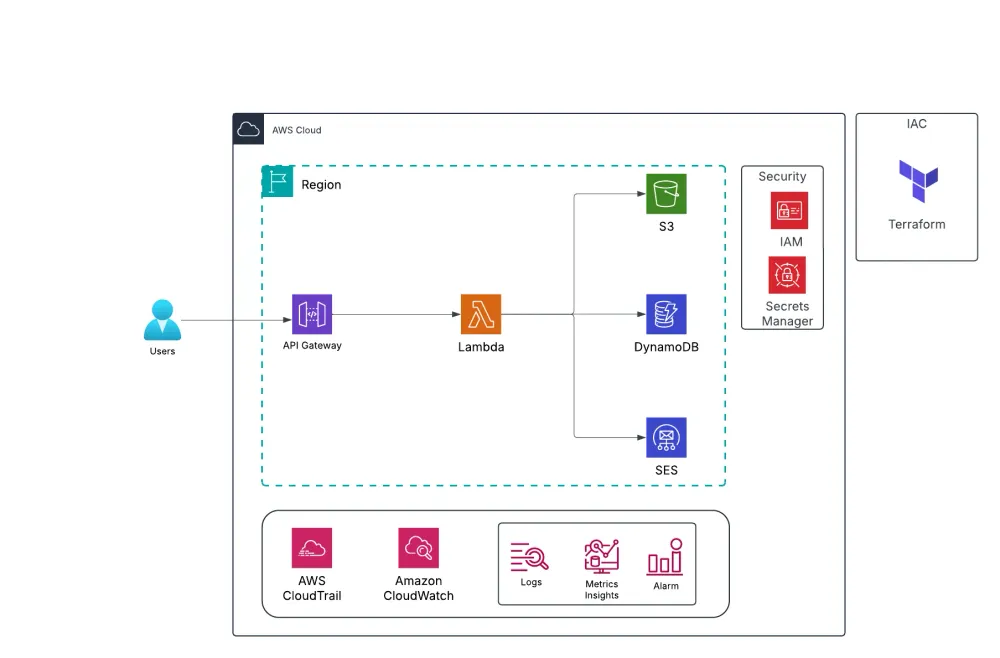
Serverless Architecture:
Prerequisites
Before implementing monitoring for your serverless application, ensure you have:
- An AWS account with appropriate IAM permissions
- A deployed serverless application using API Gateway and Lambda
- Basic understanding of CloudWatch metrics and alarms
- Access to AWS services like DynamoDB, S3, and SES (if using them)
Solution
The key monitoring metrics across different AWS Serverless services:
Namespace | Metric Name | Description |
|---|---|---|
AWS/ApiGateway | 5XXError | Number of requests with status code 5XX (server-side error) |
AWS/ApiGateway | Latency | Time between incoming request and response on API Gateway |
AWS/Lambda | Errors | Number of failed function invocations |
AWS/Lambda | Throttles | Number of throttled function invocations |
AWS/DynamoDB | ReadThrottleEvents | Number of throttled read requests |
AWS/DynamoDB | WriteThrottleEvents | Number of throttled read requests |
AWS/DynamoDB | SystemErrors | Number of server-side errors |
AWS/SES | Reputation.BounceRate | Percentage of bounced messages (multiply by 100) |
AWS/SES | Reputation.ComplaintRate | Percentage of messages reported as spam (multiply by 100) |
AWS Lambda
Lambda automatically tracks utilization and performance metrics for your functions. Monitoring this data can help you optimize your functions and manage costs.
Name | Metric type | Availability | Description |
|---|---|---|---|
Duration | Work: Performance | CloudWatch & Logs | The elapsed time for a function’s execution, in milliseconds |
Billed duration | Work: Performance | Logs | Execution time billed in 1 ms increments, rounded up to the nearest millisecond |
Memory size | Resource: Utilization | Logs | The amount of memory that is allocated to a function, in megabytes |
Max memory used | Resource: Utilization | Logs | The maximum amount of memory used for an invocation, in megabytes |
Errors | Work: Error | CloudWatch | The number of failed invocations due to function errors |
API Gateway Monitoring
Critical metrics to monitor:
- 5XX Error Rate: Set up alarms for server-side errors with a threshold of >1 over 5 periods of 60 seconds
- Latency: Monitor request-response times with p90/p95 thresholds at 500ms
Supporting Services Monitoring
While these don't require direct alarms, include them in your CloudWatch dashboard:
- Lambda: Track errors and throttles
- DynamoDB: Monitor read/write throttles and system errors
Email Service (SES) Monitoring
Set up specific alarms for:
- Bounce Rate: Alert when exceeding 5% (0.05) over 15-minute periods
- Complaint Rate: Monitor spam complaints with the same threshold
DynamoDB Monitoring
Critical metrics to monitor:
- Read/Write Throttle Events: Set up alarms when throttling occurs as it indicates capacity issues
- System Errors: Monitor for server-side errors that could impact database operations
Additional important metrics to track on your CloudWatch dashboard:
- Consumed Read/Write Capacity Units (RCU/WCU)
- Successful Request Latency
- Error rates and types
💡 Monitoring Tips:- Set appropriate alert thresholds based on application patterns and adjust regularly- Use structured logging with correlation IDs for request tracking- Create focused dashboards combining technical and business metrics- Set up different alert levels to avoid too many notifications- Review and update monitoring configurations quarterlyConclusion
The effective monitoring of serverless applications requires a different approach compared to traditional architectures. By focusing on key metrics at the API Gateway level and supplementing with service-specific monitoring, you can maintain high reliability and performance. The monitoring setup described above provides a robust foundation for maintaining the health of your serverless application.
💡Note:
Remember to regularly review and adjust your monitoring thresholds based on real-world usage patterns and requirements.
Enjoyed reading this content? Let the author know!
Your likes, comments, shares, and saves help creators reach more builders.

Loading recommendations
Loading article